
BSC Insights: Impact of temperature on System Prices
Thomas Demetriades looks at how the temperature influences the System Price. When we feel more extreme temperatures (temperatures greater than 25°C or lower than 5°C) the system is Short in 66% of Settlement Periods.
Published: August 2018
Temperatures and Prices in July
July 2018 was a particularly warm month, with the average GB noon temperature being 22°C. Elexon source the GB average noon temperature, used for setting profile coefficients, from the Met Office.
Graph 1: A comparison between System Price and temperature in July 2018
Graph 1 shows the GB average noon temperatures and daily average System Price in July 2018.
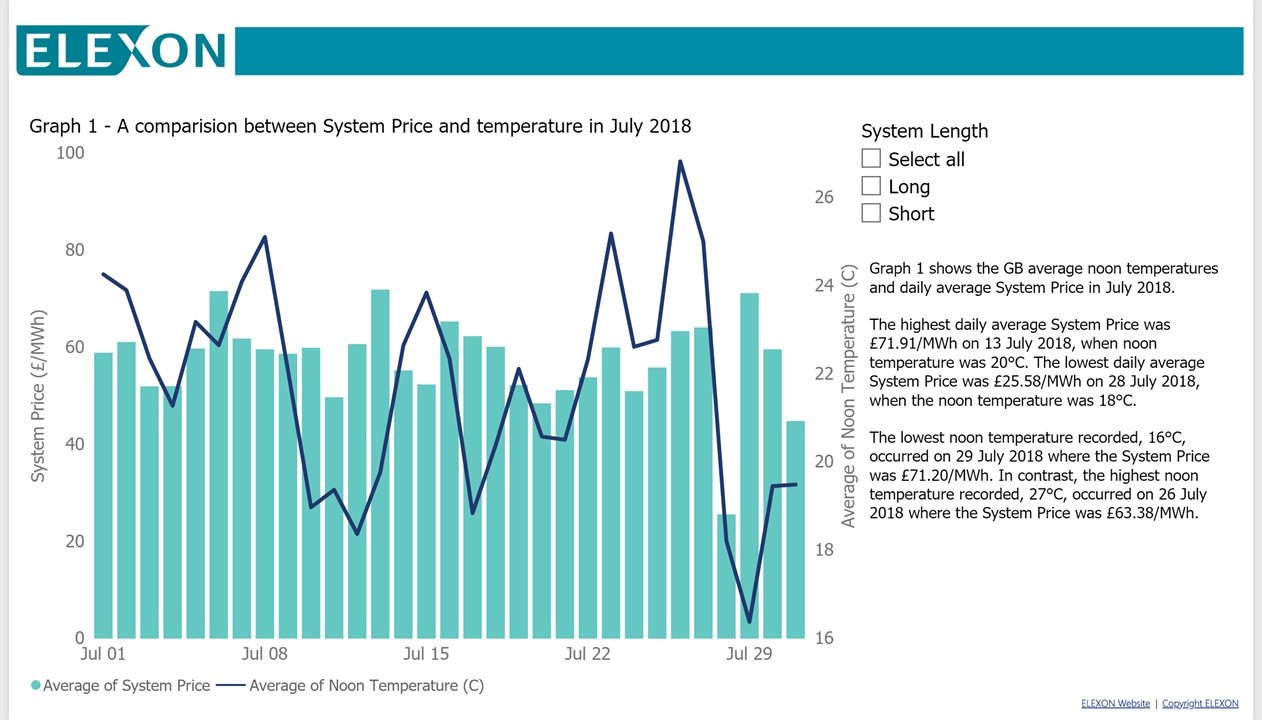
The highest daily average System Price was £71.91/MWh on 13 July 2018, when noon temperature was 20°C. The lowest daily average System Price was £25.58/MWh on 28 July 2018, when the noon temperature was 18°C.
The lowest noon temperature recorded, 16°C, occurred on 29 July 2018 where the System Price was £71.20/MWh. In contrast, the highest noon temperature recorded, 27°C, occurred on 26 July 2018 where the System Price was £63.38/MWh.
Graph 2: Average System Price and average temperature in July since 2016
Graph 2 compares July temperatures and prices in 2016, 2017, and 2018.
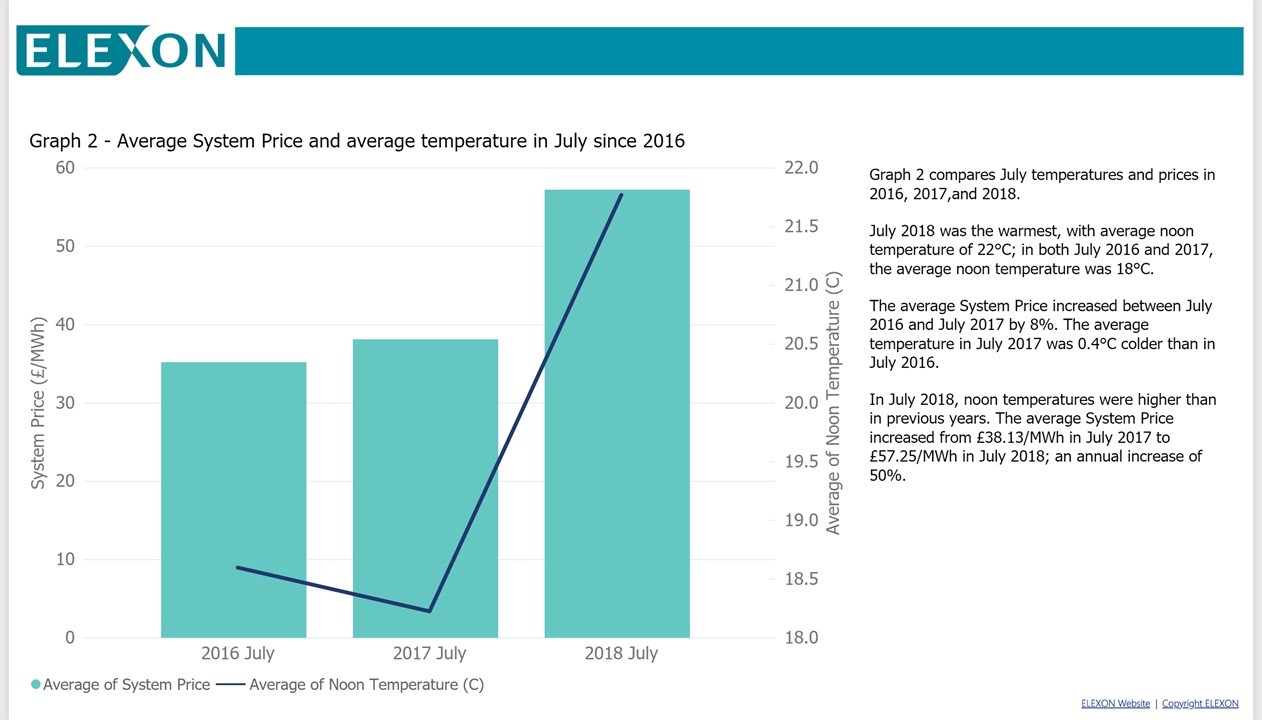
July 2018 was the warmest, with average noon temperature of 22°C; in both July 2016 and 2017, the average noon temperature was 18°C.
The average System Price increased between July 2016 and July 2017 by 8%. The average temperature in July 2017 was 0.4°C colder than in July 2016.
In July 2018, noon temperatures were higher than in previous years. The average System Price increased from £38.13/MWh in July 2017 to £57.25/MWh in July 2018; an annual increase of 50%.
Temperatures and prices since January 2016
Graph 3: System Price and system length by temperature band
Graph 3 shows the system price and system length across different temperature bands, for all Settlement Periods since the start of 2016.
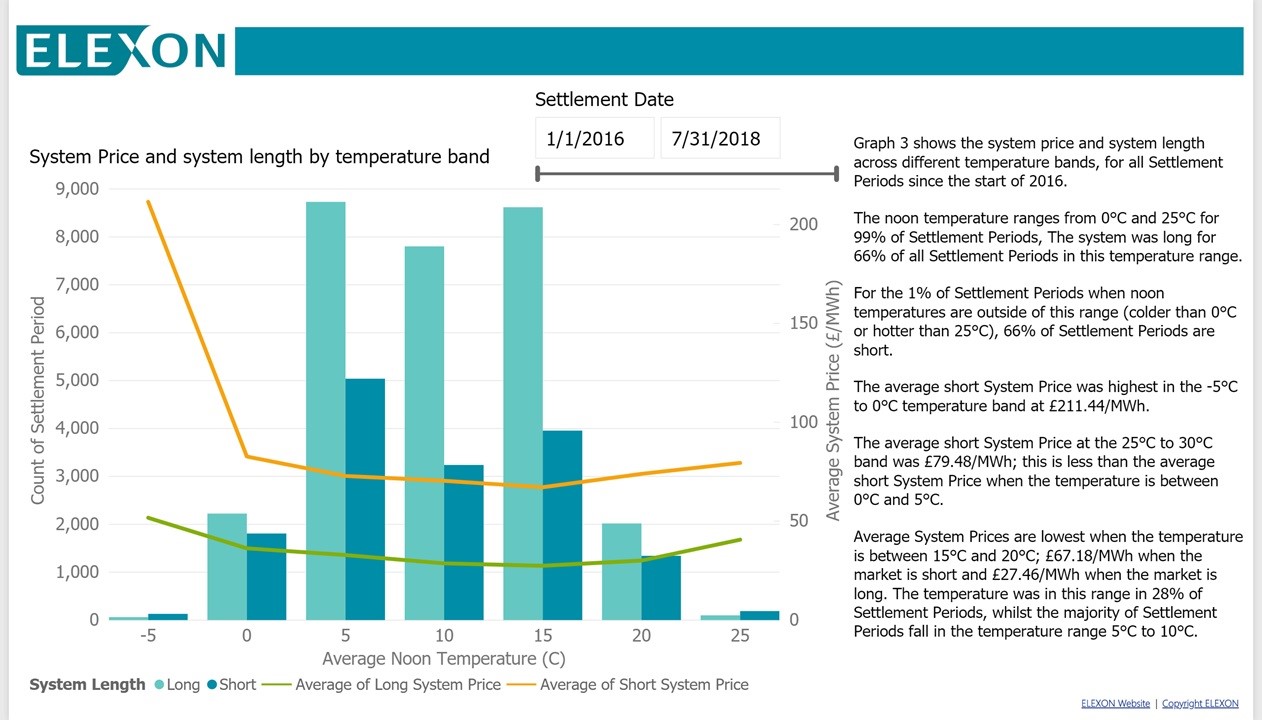
The noon temperature ranges from 0°C and 25°C for 99% of Settlement Periods, The system was long for 66% of all Settlement Periods in this temperature range.
For the 1% of Settlement Periods when noon temperatures are outside of this range (colder than 0°C or hotter than 25°C), 66% of Settlement Periods are short.
The average short System Price was highest in the -5°C to 0°C temperature band at £211.44/MWh.
The average short System Price at the 25°C to 30°C band was £79.48/MWh; this is less than the average short System Price when the temperature is between 0°C and 5°C.
Average System Prices are lowest when the temperature is between 15°C and 20°C; £67.18/MWh when the market is short and £27.46/MWh when the market is long. The temperature was in this range in 28% of Settlement Periods, whilst the majority of Settlement Periods fall in the temperature range 5°C to 10°C.
Graph 4: Maximum and minimum System Prices and temperatures since 2016
Graph 4 shows the maximum and minimum System Prices and noon temperatures, between January 2016 and July 2018. 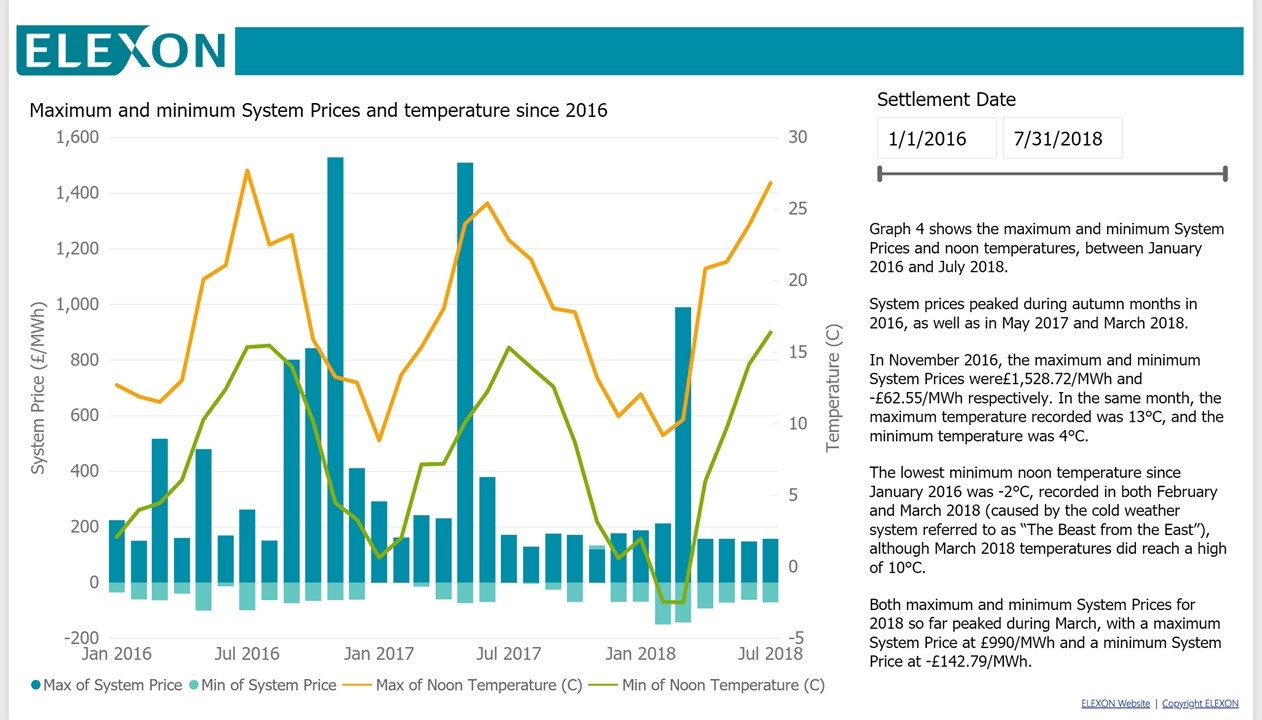
System prices peaked during autumn months in 2016, as well as in May 2017 and March 2018.
In November 2016, the maximum and minimum System Prices were £1,528.72/MWh and -£62.55/MWh respectively. In the same month, the maximum temperature recorded was 13°C, and the minimum temperature was 4°C.
As temperatures started to fall in September 2016, the maximum System Prices started to increase and kept rising up until November 2016, after which they fell to £411.91/MWh in December 2016.
The lowest minimum noon temperature since January 2016 was -2°C, recorded in both February and March 2018 (caused by the cold weather system referred to as “The Beast from the East”), although March 2018 temperatures did reach a high of 10°C.
Both maximum and minimum System Prices for 2018 so far peaked during March, with a maximum System Price at £990/MWh and a minimum System Price at -£142.79/MWh.