BSC Insights: System Prices from 2001 to 2016
Emma Tribe’s article, A price for all seasons, time travels with System Prices looking at seasonal trends from 2001 to 2016. It uses analysis from the System Price Analysis Report (SPAR) August 2017.
Published: October 2017
Seasonal System Price graphs
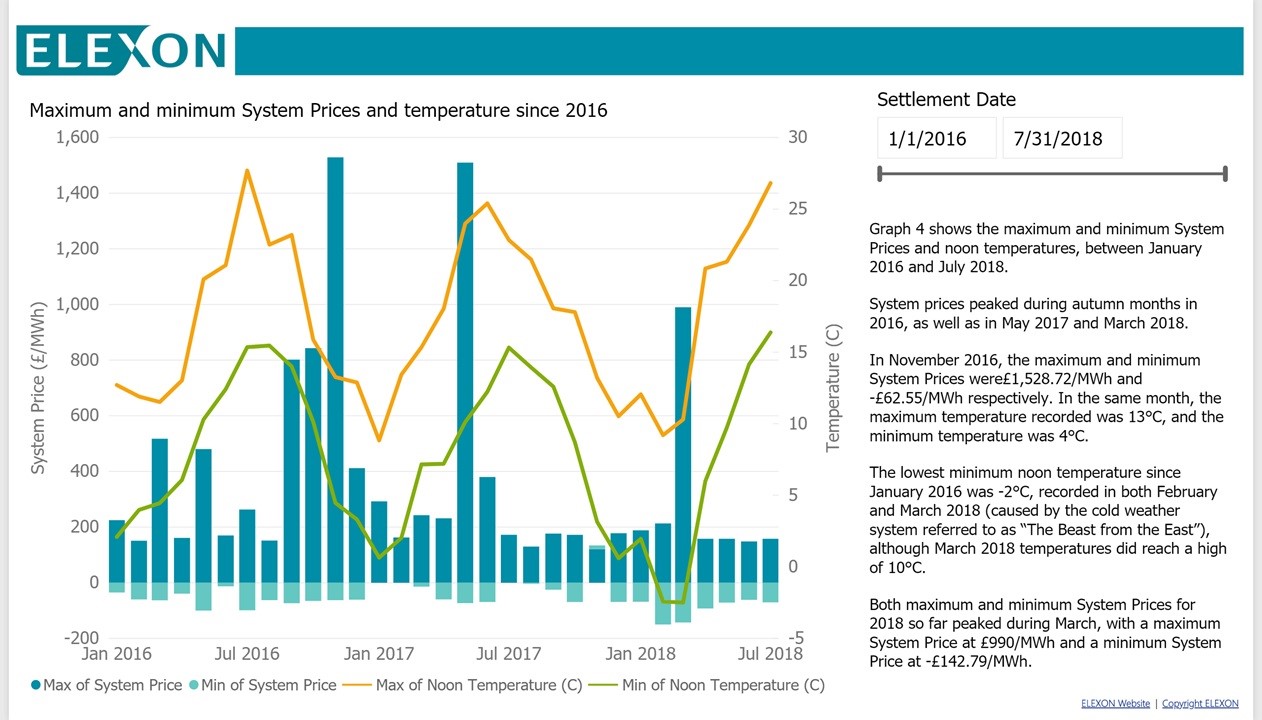
Autumn 2016 saw the System Price rise to £1,529/MWh, this was the highest System Price since 2001 when the System Price rose to £5,003/MWh in one Settlement Period. The minimum was -£62.55/MWh.
The lowest minimum noon temperature since January 2016 was -2 degree recorded in both February and March 2018 (caused by ‘Beast from the East’) although March 2018 temperature did reach a high of 10 degrees.
Both maximum and minimum System Prices for 2018 so far peaked during March, with a maximum System Price at £990/MWh and a minimum of -£142.79/MWh.
List of graphs
- Average System Price by season
- Average System Price by Settlement Period by System Length
- Frequency of System Prices in autumn 2003-2016
- Standard deviation of autumn System Prices
Four Seasons
The earliest Settlement Day with System Prices we have data for was 27 March 2001, a bygone era when Atomic Kitten were in their hay day making hits like whole again.
Graph 1.1 shows average System Prices from this date by BSC Season and year. Over 15 years the average System Price has risen by £31/MWh from £19/MWh in autumn 2001, to £50/MWh in autumn 2016.
In summer 2008 Usain Bolt managed to break the 100m world record at the Beijing Olympics, the seasonal average System Price that summer was £77/MWh, the highest it’s ever been. In the same year the autumn average System Price was also high at £71/MWh. Autumn has had the highest seasonal average System Price during five of the last 16 years, while winter has had the highest seasonal average prices in nine years.
While time travelling through System Prices it’s important to note that since 2001 there have been 21 approved Pricing Modifications. Some of these modifications have changed the way the System Price is calculated.
Notable pricing modifications that have altered the calculation of the System Price include BSC Modification P305 implemented in November 2015, BSC Modification P217 implemented in November 2009 and BSC Modification P78 implemented in February 2003. A 12 month post-P305 review was published in February 2017 looking back to the start of P305.
Graph 1.2 shows the average System Price by BSC Season and Settlement Period and market length from 14 years of System Price. The data is averaged from 11 March 2003 onwards, as we do not have Net Imbalance Volume (NIV) data before this date. We use the NIV to differentiate between the system being long (an excess or electricity in a Settlement Period) and the system being short (a deficit of electricity in a Settlement Period).
In the graph, winter and autumn show a more pronounced evening average System Price peak compared to spring and summer. In autumn when the system is short, a System Price peak occurs in Settlement Period 35, this Settlement Period runs from 17.00 to 17.30, prime cup of tea time in any year. When the system is long there is a System Price peak in Settlement Period 38, which runs from 18.30 to 19.00.
Graph 1.2 also shows us that in autumn when the market is short the average System Price varies between £39/MWh and £108/MWh. The average range of prices while the market is long is between £25/MWh and £44/MWh.
Autumn delight
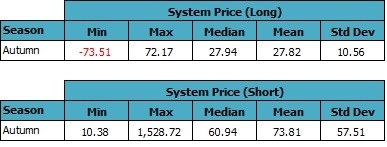
Table 2.1 – Autumn System Price summary (£/MWh) 2003-2016

Source: Elexon
Table 2.1 shows a summary of System Prices in autumns between 2003 and 2016, where the autumn season runs from 1 September to 30 November. Whether the system is long or short causes a difference of £46/MWh in average System Price. The mean long System Price is £28/MWh and the mean short price £74/MWh.
The maximum System Price in autumn was £1,529/MWh and the minimum was -£74/MWh both of these prices occurred in Settlement Periods in autumn 2016.
Graph 1.3 shows the distribution of System Prices in autumn between 2003 and 2016. In 70% of Settlement Periods in autumn between 2003 and 2016 the system is long. In 88% of long Settlement Periods in autumn the System Price is between £10/MWh and £40/MWh.
When the system is short, 52% of System Prices are between £40/MWh and £70/MWh. System Prices over £150/MWh occur in 6% of Short Settlement Periods. There have been six Settlement Periods in autumn with Main Prices over £1,000/MWh, all in November 2016.
There is a greater spread of prices when the system is short compared when the system is long. The standard deviation of long autumn prices is £11/MWh compared to £58/MWh when the market is short.
Graph 1.4 shows how the standard deviation of System prices changes by year. The Standard Deviation is used as a measure of the spread of System Prices. The spread of short System Prices is smallest in the autumns of 2010 to 2015 when the standard deviation of prices is between £20/MWh and £30/MWh. 2016 is the first full autumn since the implementation of BSC Modification P305, in this year the standard deviation of System Prices is £130/MWh.
Graph 1.1 shows that the average autumn System Price has increased by £8/MWh between 2015 and 2016. Over the same period the standard deviation increased by £105/MWh while the market was short, and £7/MWh while the market was long. This increase in spread was a result of BSC Modification P305 and the autumn 2016 market conditions.
If the standard deviation of prices stay high in autumn 2017, then the market could see more Settlement Periods with System Prices over £1,000/MWh and less than -£50/MWh.


