
BSC Insights: Replacement Price setting the Imbalance Price
Emma Tribe’s SPAR insight article looks at how often the Replacement Price is calculated using the Market Index Price (MIP). Where there are no priced actions, the Replacement Price sets the Imbalance Price.
Published: June 2018
When is the Replacement Price used?
The Replacement Price was used to set the Imbalance Price in 21% of long Settlement Periods, and 5% of short Settlement Periods, between November 2015 and June 2018. However in recent months this has risen, reaching 58% of long Settlement Periods in June 2018.
Graph 1: Replacement Price and flagged actions since P305
Use of the Replacement Price and flagged actions since P305 when the market is long, shows the percentage of long Settlement Periods where the Replacement Price set the Imbalance Price, and the percentage of flagged sell balancing volume.
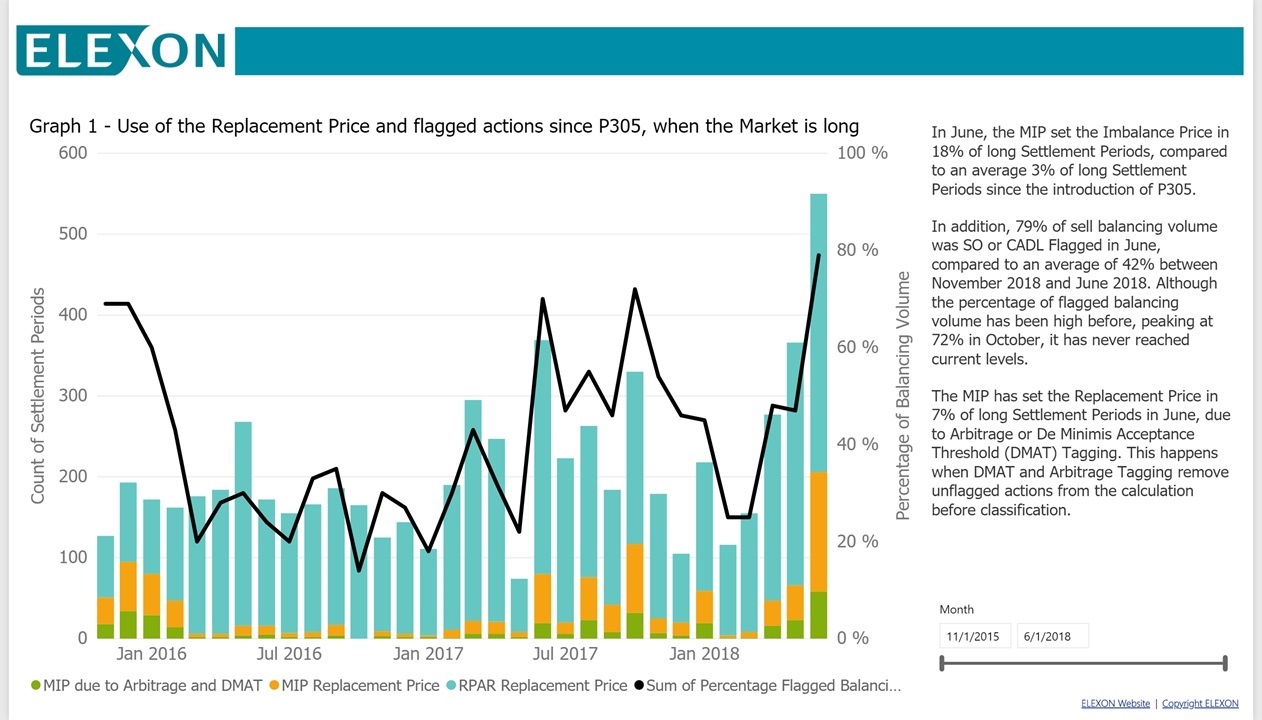
In June, the MIP set the Imbalance Price in 18% of long Settlement Periods, compared to an average 3% of long Settlement Periods since the introduction of P305.
In addition, 79% of sell balancing volume was SO or CADL Flagged in June, compared to an average of 42% between November 2018 and June 2018. Although the percentage of flagged balancing volume has been high before, peaking at 72% in October, it has never reached current levels.
The MIP has set the Replacement Price in 7% of long Settlement Periods in June, due to Arbitrage or De Minimis Acceptance Threshold (DMAT) Tagging. This happens when DMAT and Arbitrage Tagging remove unflagged actions from the calculation before classification.
Graph 2: Flagged and unflagged sell balancing volumes
This shows the volume of flagged actions since November 2018 to date.
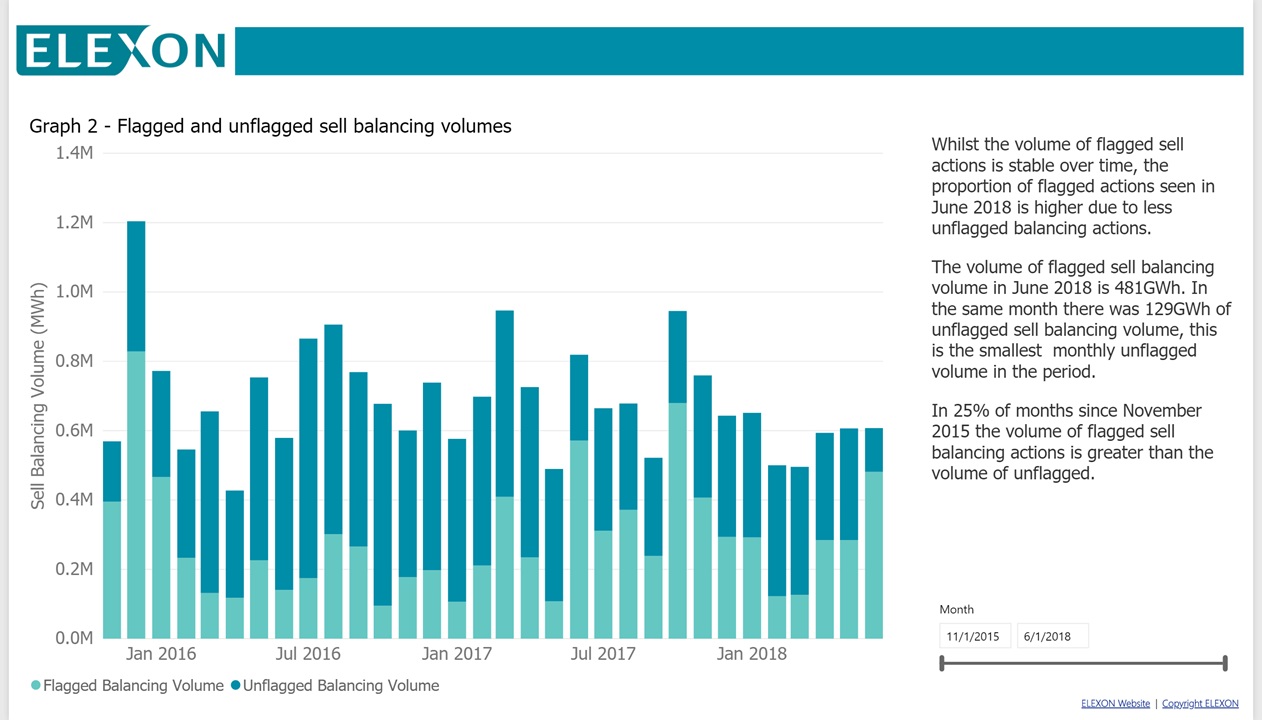
Whilst the volume of flagged sell actions is stable over time, the proportion of flagged actions seen in June 2018 is higher due to less unflagged balancing actions.
The volume of flagged sell balancing volume in June 2018 is 481GWh. In the same month there was 129GWh of unflagged sell balancing volume, this is the smallest monthly unflagged volume in the period.
In 25% of months since November 2015 the volume of flagged sell balancing actions is greater than the volume of unflagged.
Graph 3: Replacement Price compared to percentage of flagged sell volume
Percentage of long Settlement Periods where Replacement Price is used in a month compared to percentage of flagged sell volume, uses the same data as graph 1.
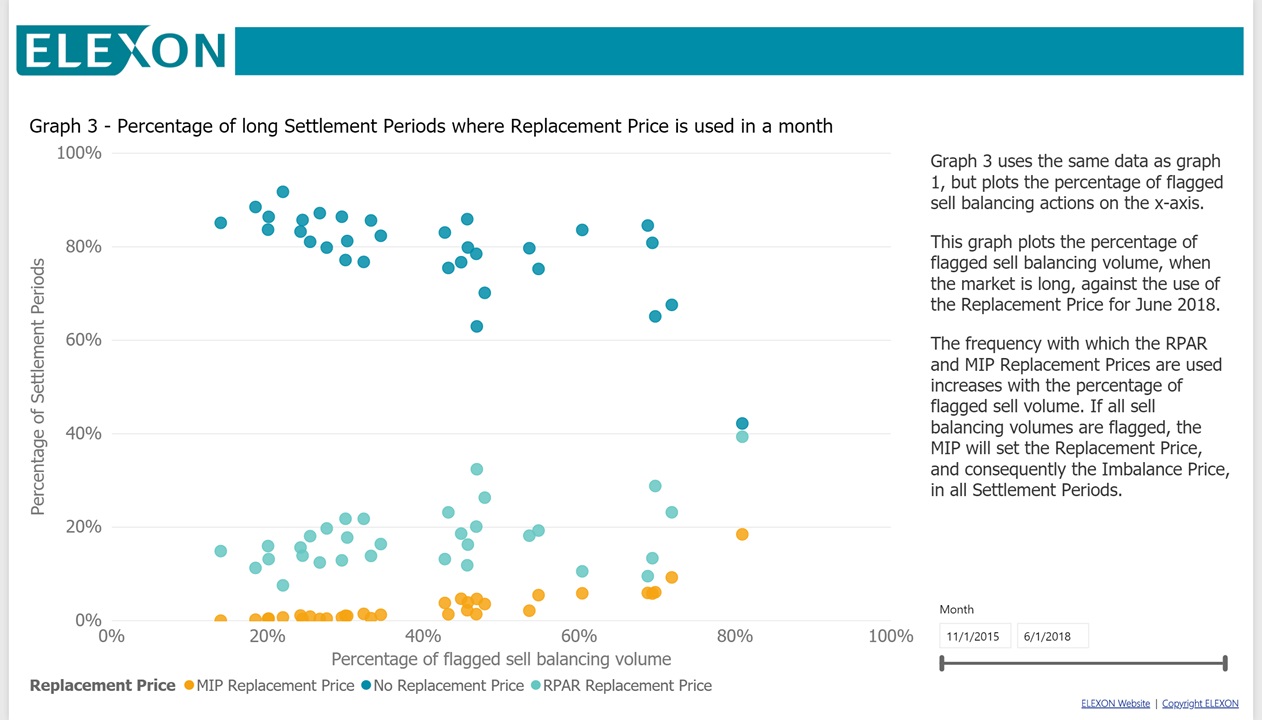
However, it plots the percentage of flagged sell balancing actions on the x-axis. The graph plots the percentage of flagged sell balancing volume, when the market is long, against the use of the Replacement Price for all months between November 2015 and June 2018.
The frequency with which the RPAR and MIP Replacement Prices are used increases with the percentage of flagged sell volume. If all sell balancing volumes are flagged, the MIP will set the Replacement Price, and consequently the Imbalance Price in all Settlement Periods.
Graph 4: Arbitrage Tagged and number of arbitrage active Settlement Periods
This shows the percentage of Arbitrage Tagged volume in June 2018 was 2.01%, with Arbitrage Tagging occurring in 350 Settlement Periods.
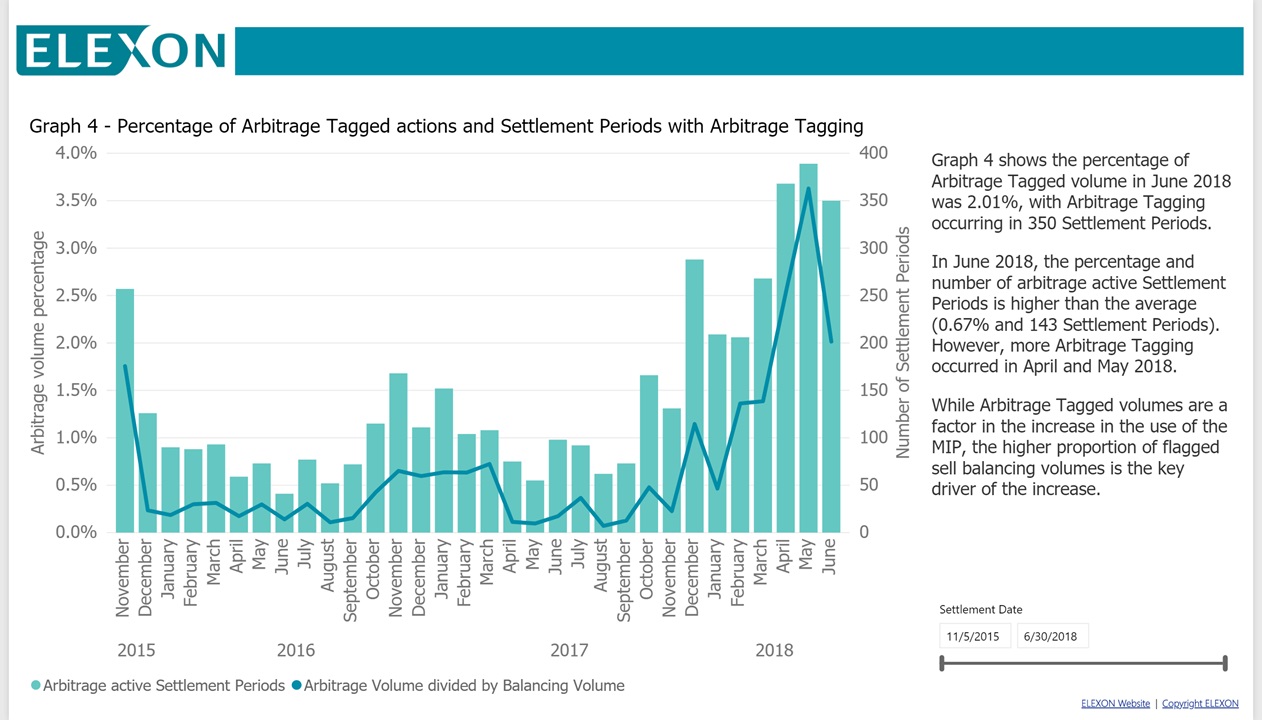
In June 2018, the percentage and number of arbitrage active Settlement Periods is higher than the average (0.67% and 143 Settlement Periods). However, more Arbitrage Tagging occurred in April and May 2018.
While Arbitrage Tagged volumes are a factor in the increase in the use of the MIP, the higher proportion of flagged sell balancing volumes is the key driver of the increase.
What impact is this having on the Imbalance Price?
The Replacement Price is applied to Stage 2 Flagged actions after Net Imbalance Volume (NIV) Tagging, but before Price Average Reference (PAR) Tagging.
Graph 5: Replacement Price in June and sell actions against System Price
Replacement Price use in June, and average price of sell actions against average System Price when the market is long, shows, for when the market is long: the average of the Energy Imbalance Price, the average price of sell actions, and the average price of actions after NIV Tagging.
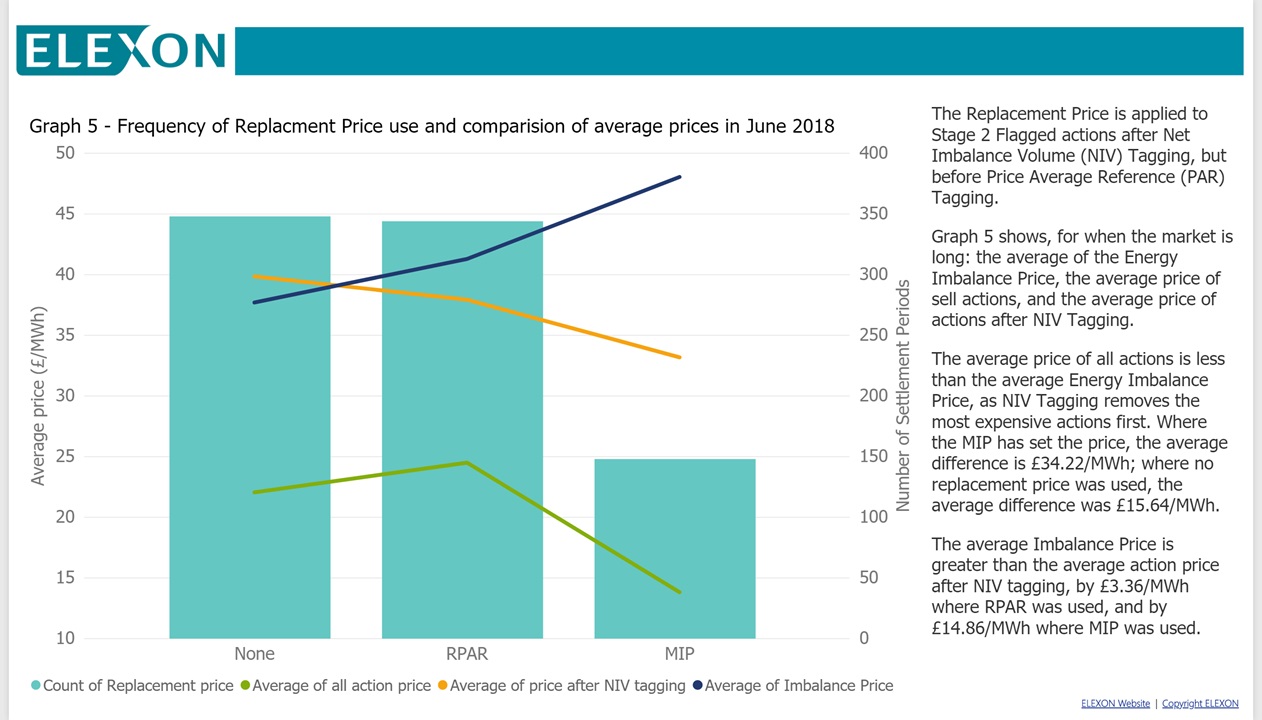
The average price of all actions is less than the average Energy Imbalance Price, as NIV Tagging removes the most expensive actions first. Where the MIP has set the price, the average difference is £34.22/MWh; where no replacement price was used, the average difference was £15.64/MWh.
The average Imbalance Price is greater than the average action price after NIV tagging, by £3.36/MWh where RPAR was used, and by £14.86/MWh where MIP was used.
Graph 6: Imbalance Price compared to NIV by Replacement Price
Imbalance Price compared to the NIV by Replacement Price in June 2018, shows the Imbalance Price and calculation method against the NIV.
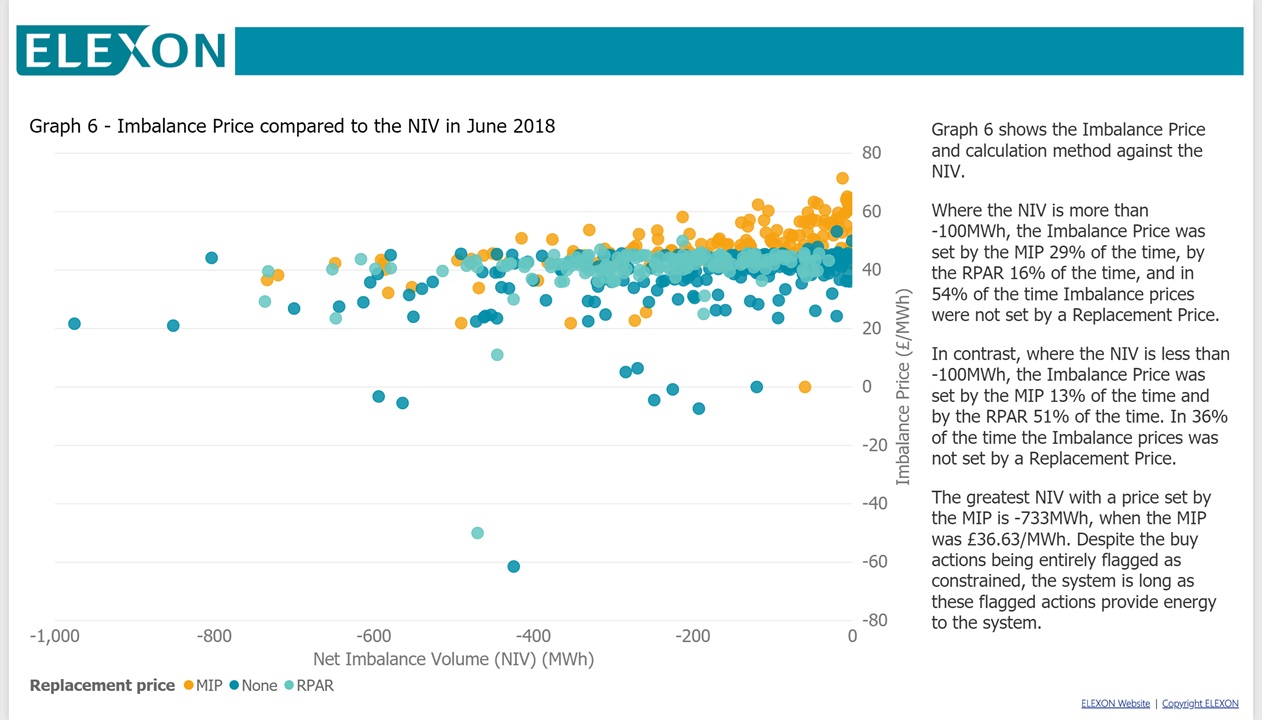
Where the NIV is more than -100MWh, the Imbalance Price was set by the MIP 29% of the time, by the RPAR 16% of the time, and in 54% of the time Imbalance prices were not set by a Replacement Price.
In contrast, where the NIV is less than -100MWh, the Imbalance Price was set by the MIP 13% of the time and by the RPAR 51% of the time.
In 36% of the time the Imbalance prices was not set by a Replacement Price when the NIV is less than -100MWh.
The greatest NIV with a price set by the MIP is -733MWh, when the MIP was £36.63/MWh. Despite the buy actions being entirely flagged as constrained, the system is long as these flagged actions provide energy to the system.
What happens next?
The next scheduled Market Index Definition Statement (MIDS) review will incorporate this analysis, and is due to be presented at the ISG meeting in September.
Looking further ahead, the European Harmonisation Modification, scheduled to be implemented in 2020, may consider whether the MIP should continue to be used as a default.