
BSC Insights: System Prices in 2018
In this Elexon Insight, Nick Baker, one of our Market Analysts, takes a detailed look at System Prices across 2018. What does the data tell us and were there circumstances that impacted on it?
2018 overview
In 2018 the lowest System Price (-£150/MWh) in a Settlement Period, since the implementation of BSC Modification P305 in November 2015, occurred in February 2018. The second part of the P305 System Price calculation changes were also introduced from November 2018.
In 2018 the average System Price when the System was long was £41.39/MWh, an increase from £30.77/MWh in 2017. When the System was short, the average System Price was £78.84/MWh.
Frequency of System Prices
Graph 1 shows the frequency of System Prices in 2018. Regardless of system length, in 59% of Settlement Periods the System Price was between £30/MWh and £60/MWh.
When the System was long, 47% of prices were between £40/MWh and £50/MWh. 46% of System Prices were between £60/MWh and £80/MWh when the System was short. When short, 9% of System Prices were greater than £100/MWh.
The evening peak in short System Prices in 2018 reached a maximum in Settlement. Period 35, where the average price was £96.80/MWh. In 2017, short System Prices reached a maximum Settlement Period 33, where the average price was £96.61/MWh.
The average short System Prices in 2017 show two peaks, with the morning average System Price increasing by £9.38/MWh between Settlement Period 14 and 15.
Average long Settlement Period System Prices in 2018 were higher in every Settlement Period compared to 2017, with prices ranging between £36.23/MWh and £47.22/MWh. In 2017, average long Settlement Period System Prices ranged between £26.77/MWh and £34.74/MWh.
High and low System Prices
Graph 2 shows the frequency of high and low System Prices in 2018.
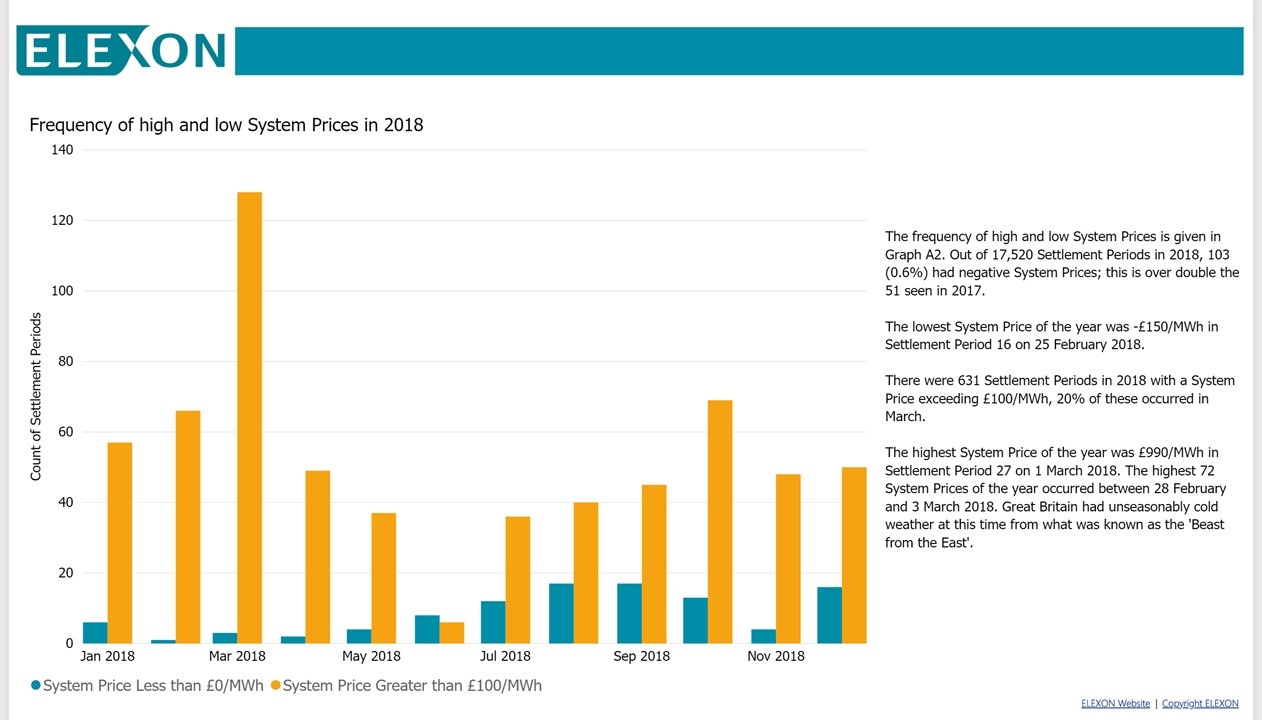
Out of 17,520 Settlement Periods in 2018, 103 (0.6%) had negative System Prices; this is over double the 51 seen in 2017.
The lowest System Price of the year was -£150/MWh in Settlement Period 16 on 25 February 2018.
There were 631 Settlement Periods in 2018 with a System Price exceeding £100/MWh, 20% of these occurred in March.
The highest System Price of the year was £990/MWh in Settlement Period 27 on 1 March 2018. The highest 72 System Prices of the year occurred between 28 February and 3 March 2018.
Great Britain had unseasonably cold weather at this time from what was known as the ‘Beast from the East’.
Median and Interquartile Range
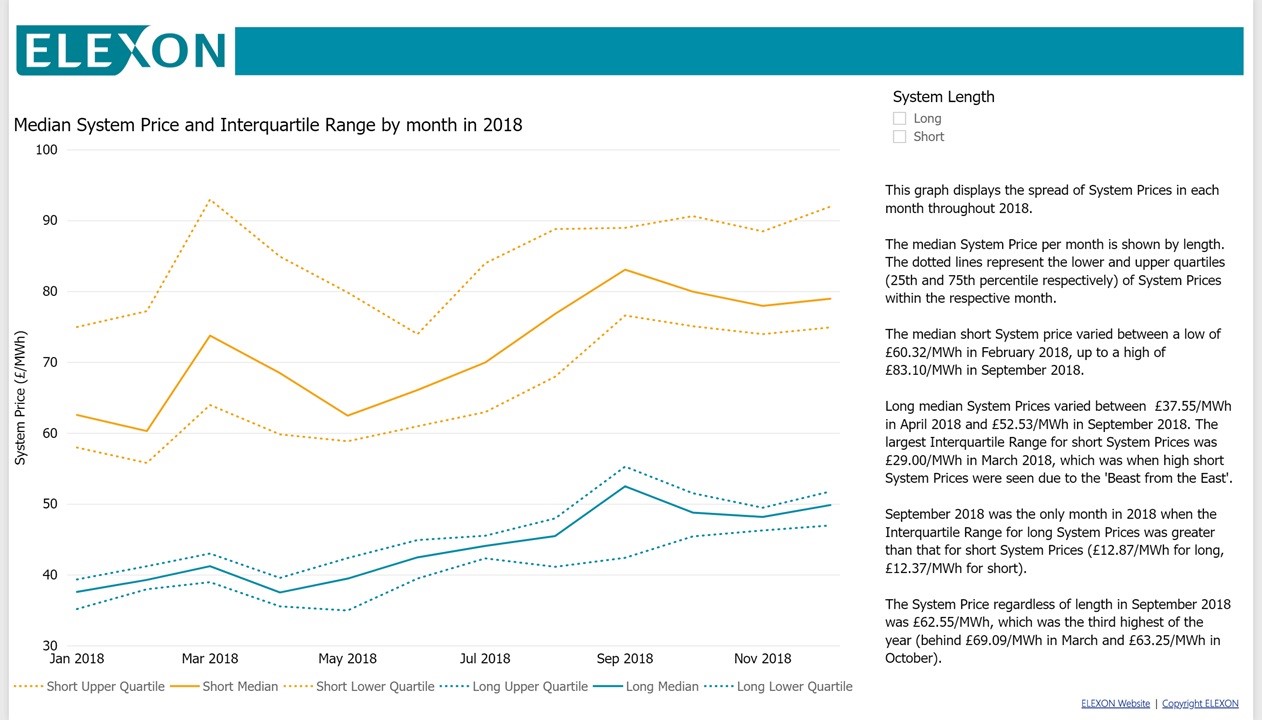
Graph 3 displays the Median System Price and Interquartile Range by month in 2018. It shows the spread of System Prices in each month throughout 2018.
Median System Price per month
The median System Price per month is shown by length. The shaded area represents difference between the lower and upper quartiles (25th and 75th percentile respectively) of System Prices within the respective month.
The median short System price varied between a low of £60.32/MWh in February 2018, up to a high of £83.10/MWh in September 2018. Long median System Prices varied between £37.55/MWh in April 2018 and £52.53/MWh in September 2018.
Interquartile Range
The largest Interquartile Range for short System Prices was £29.00/MWh in March 2018, which was when high short System Prices were seen due to the ‘Beast from the East’.
September 2018 was the only month in 2018 when the Interquartile Range for long System Prices was greater than that for short System Prices (£12.87/MWh for long, £12.37/MWh for short).
The System Price regardless of length in September 2018 was £62.55/MWh, which was the third highest of the year (behind £69.09/MWh in March and £63.25/MWh in October)
Net Imbalance Volume
Graph 4 displays a scatter graph of Net Imbalance Volume (NIV) and System Prices in 2018. The dashed lines display a 0MWh NIV and a £0/MWh System Price.
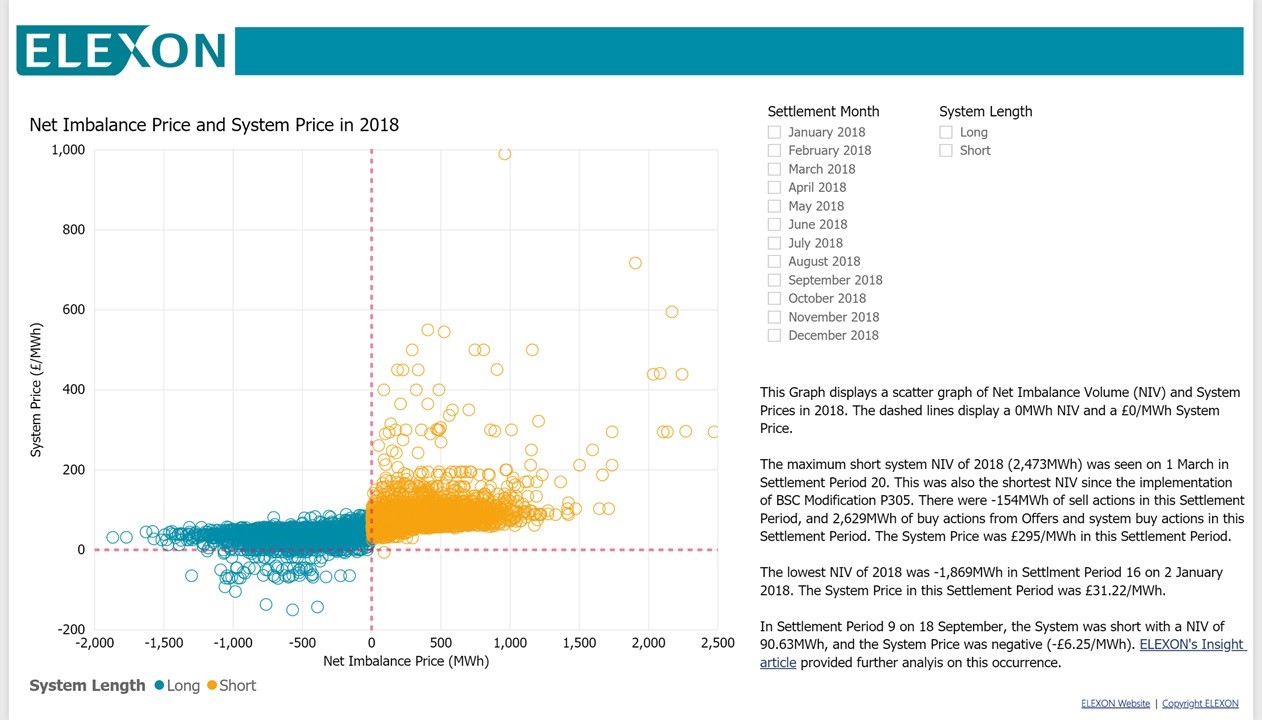
The maximum short system NIV of 2018 (2,473MWh) was seen on 1 March in Settlement Period 20. This was also the shortest NIV since the implementation of BSC Modification P305.
There were -154MWh of sell actions in this Settlement Period, and 2,629MWh of buy actions from Offers and system buy actions in this Settlement Period.
The System Price was £295/MWh in this Settlement Period.
The lowest NIV of 2018 was -1,869MWh in Settlment Period 16 on 2 January 2018. The System Price in this Settlement Period was £31.22/MWh.
In Settlement Period 9 on 18 September, the System was short with a NIV of 90.63MWh, and the System Price was negative (-£6.25/MWh).
Further analysis
Elexon provided further analyis on this occurrence in September.
- Elexon Insights: Negative short System Price (18 September 2018)
System length by month
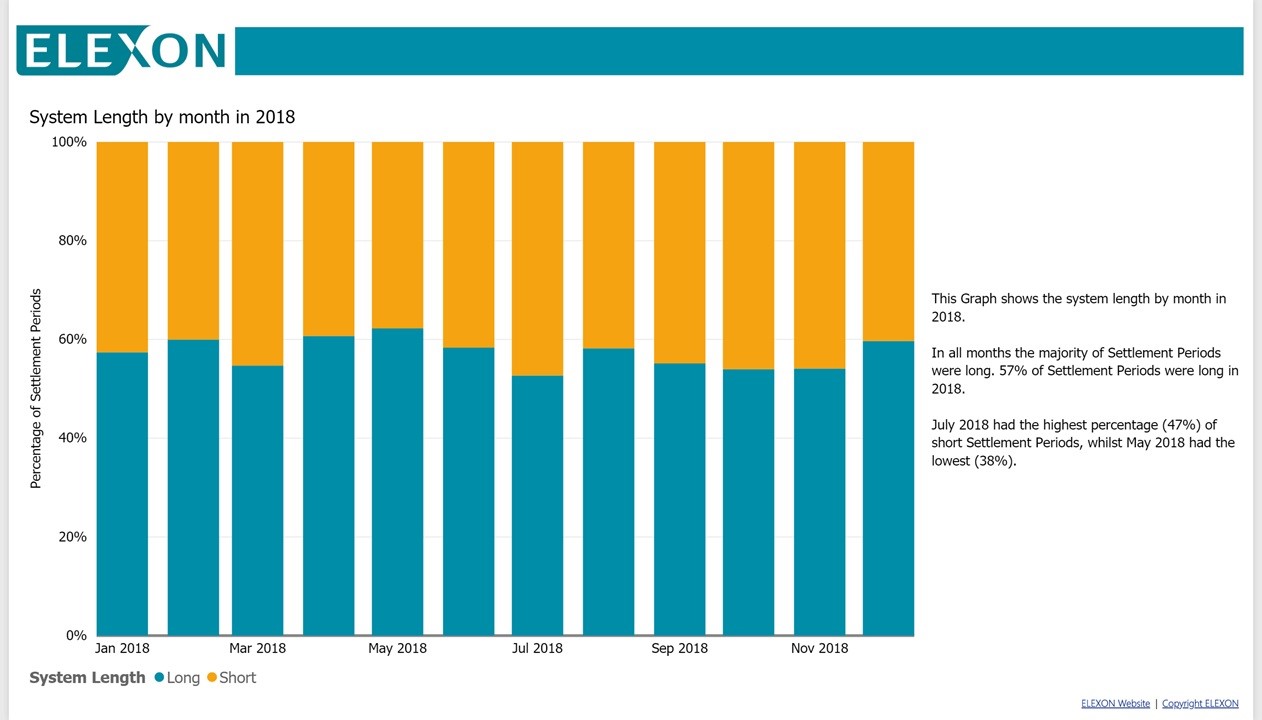
Graph 5 shows the system length by month in 2018. In all months the majority of Settlement Periods were long. 57% of Settlement Periods were long in 2018.
July 2018 had the highest percentage (47%) of short Settlement Periods, whilst May 2018 had the lowest (38%).
Average by Settlement Period
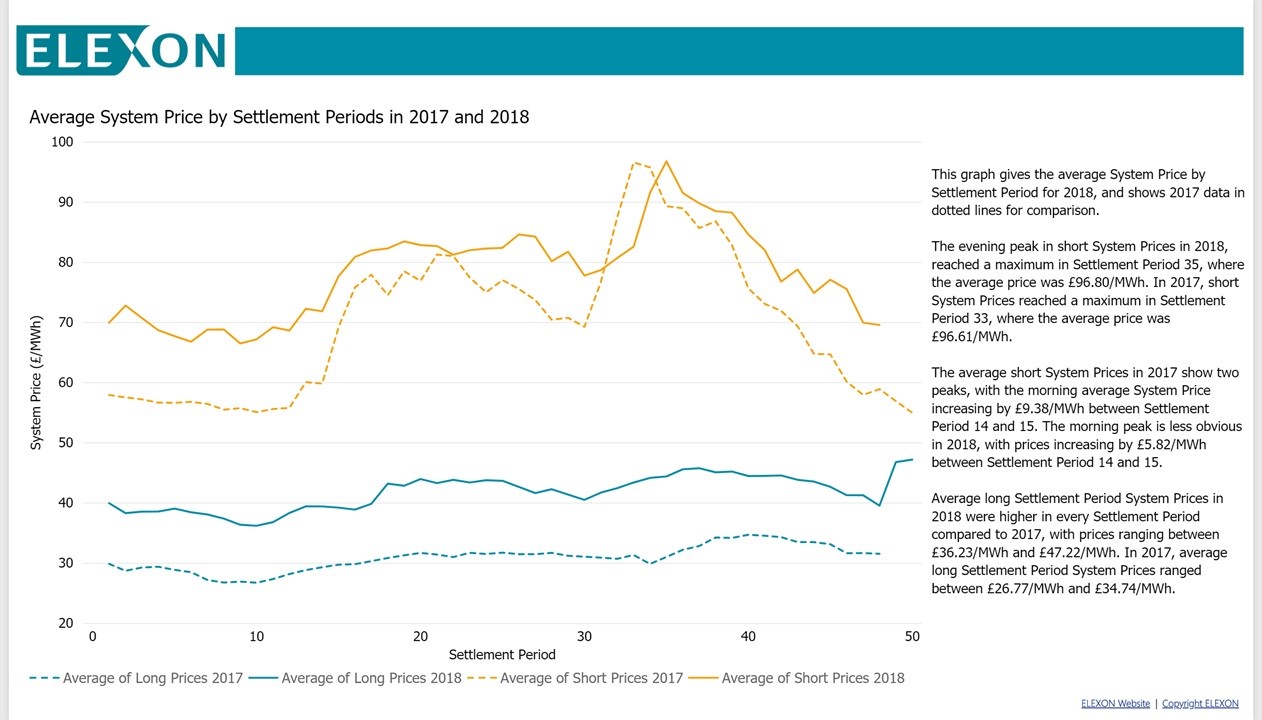
Graph 6 gives the average System Price by Settlement Period for 2018, and shows 2017 data for comparison.


Short
The evening peak in short System Prices in 2018, reached a maximum in Settlement Period 35, where the average price was £96.80/MWh.
In 2017, short System Prices reached a maximum in Settlement Period 33, where the average price was £96.61/MWh.
The average short System Prices in 2017 show two peaks, with the morning average System Price increasing by £9.38/MWh between Settlement Period 14 and 15.
The morning peak is less obvious in 2018, with prices increasing by £5.82/MWh between Settlement Period 14 and 15.
Long
Average long Settlement Period System Prices in 2018 were higher in every Settlement Period compared to 2017, with prices ranging between £36.23/MWh and £47.22/MWh.
In 2017, average long Settlement Period System Prices ranged between £26.77/MWh and £34.74/MWh.