
BSC Insights: What’s the impact of changing DMAT and CADL?
Elexon are currently consulting on two Imbalance Price Calculation parameters. Emma Tribe’s insight article highlights the potential impact on prices of changing the De Minimis Acceptance Threshold (DMAT) and the Continuous Acceptance Duration Limit (CADL).
Published: November 2018
Getting your input
Elexon undertakes analysis on behalf of the BSC Panel on the values of DMAT and CADL to ensure they remain fit for purpose. In the latest review, we are recommending a change to these parameters. The full analysis is available to view on the consultation page.
We are requesting the views of Market Participants by consultation and would be grateful for your views on the values of these parameters. Please make your views known by filling out the pro-forma on the consultation page.
Please note that the consultation closes at 17:00 on 9 November 2018.
How does DMAT and CADL work?
The Imbalance Price is designed to represent the marginal price of energy balancing actions taken by the System Operator. DMAT and CADL are two parameters used in the Imbalance Price Calculation to tag and flag system actions that could distort the Imbalance Price.
Balancing actions that have a volume less than DMAT are tagged as system actions and removed from the calculation. DMAT is currently set to 1MWh, and we are recommending this is reduced to 0.1MWh.
Balancing actions taken in the Balancing Mechanism with duration less than CADL are flagged as having been taken for system balancing reasons. The price of flagged actions are assessed against the price of the most expensive unflagged action, and potentially repriced for the purposes of calculating the Imbalance Price. CADL is currently 15 minutes, and we are recommending this be reduced to 10 minutes.
Identifying the impact on Imbalances Prices
Our data visualisation allows you to see the average prices and number of Settlement Periods where prices change.
Number of and maximum changes to Imbalance Prices
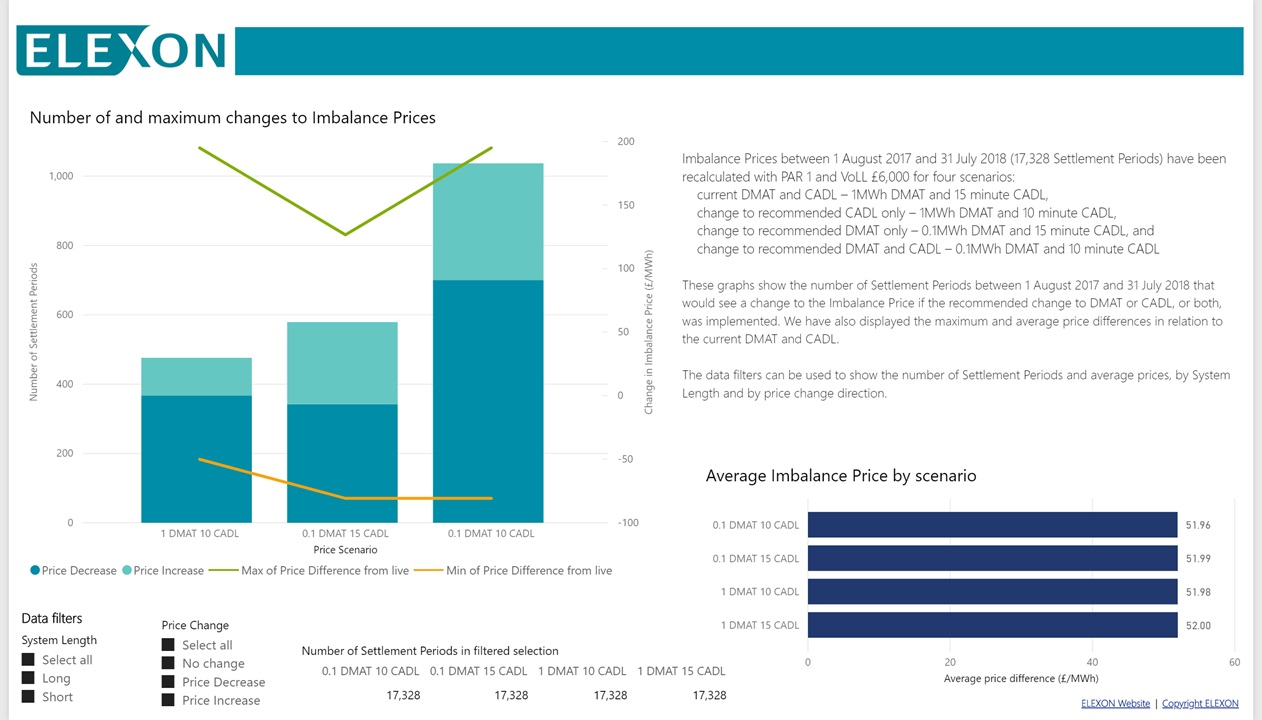
Imbalance Prices between 1 August 2017 and 31 July 2018 (17,328 Settlement Periods) have been recalculated with PAR 1 and VoLL £6,000 for four scenarios:
- current DMAT and CADL – 1MWh DMAT and 15 minute CADL
- change to recommended CADL only – 1MWh DMAT and 10 minute CADL
- change to recommended DMAT only – 0.1MWh DMAT and 15 minute CADL
- change to recommended DMAT and CADL – 0.1MWh DMAT and 10 minute CADL
These graphs show the number of Settlement Periods between 1 August 2017 and 31 July 2018 that would see a change to the Imbalance Price if the recommended change to DMAT or CADL, or both, was implemented.
We have also displayed the maximum and average price differences in relation to the current DMAT and CADL. The data filters can be used to show the number of Settlement Periods and average prices, by System Length and by price change direction.
Analysis that steers our recommendations
Offers, Bids and BSAA tagged and percentage removed with price greater than two standard deviations from the mean
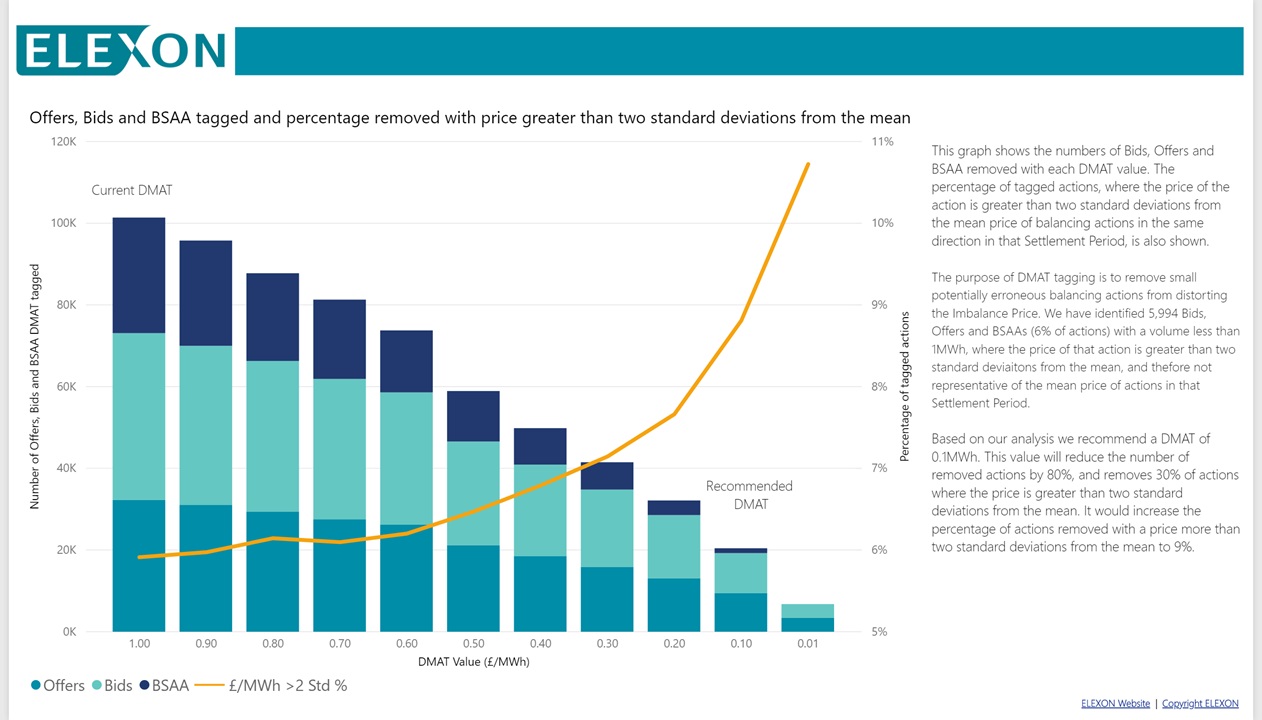
This graph shows the numbers of Bids, Offers and BSAA removed, against each DMAT value. The percentage of tagged actions where the price of the action is greater than two standard deviations from the mean price of balancing actions in the same direction in that Settlement Period, is also shown.
The purpose of DMAT tagging is to remove small potentially erroneous balancing actions from distorting the Imbalance Price. We have identified 5,994 Bids, Offers and BSAAs (6% of actions) with a volume less than 1MWh, where the price of that action is greater than two standard deviations from the mean, and therefore not representative of the mean price of actions in that Settlement Period.
Based on our analysis we recommend a DMAT of 0.1MWh. This value will reduce the number of number of removed actions by 80%, and removes 30% of actions where the price is greater than two standard deviations from the mean. It would increase the percentage of actions removed with a price more than two standard deviations from the mean to 9%.
Fast Reserve and Non-Fast Reserve actions by action duration
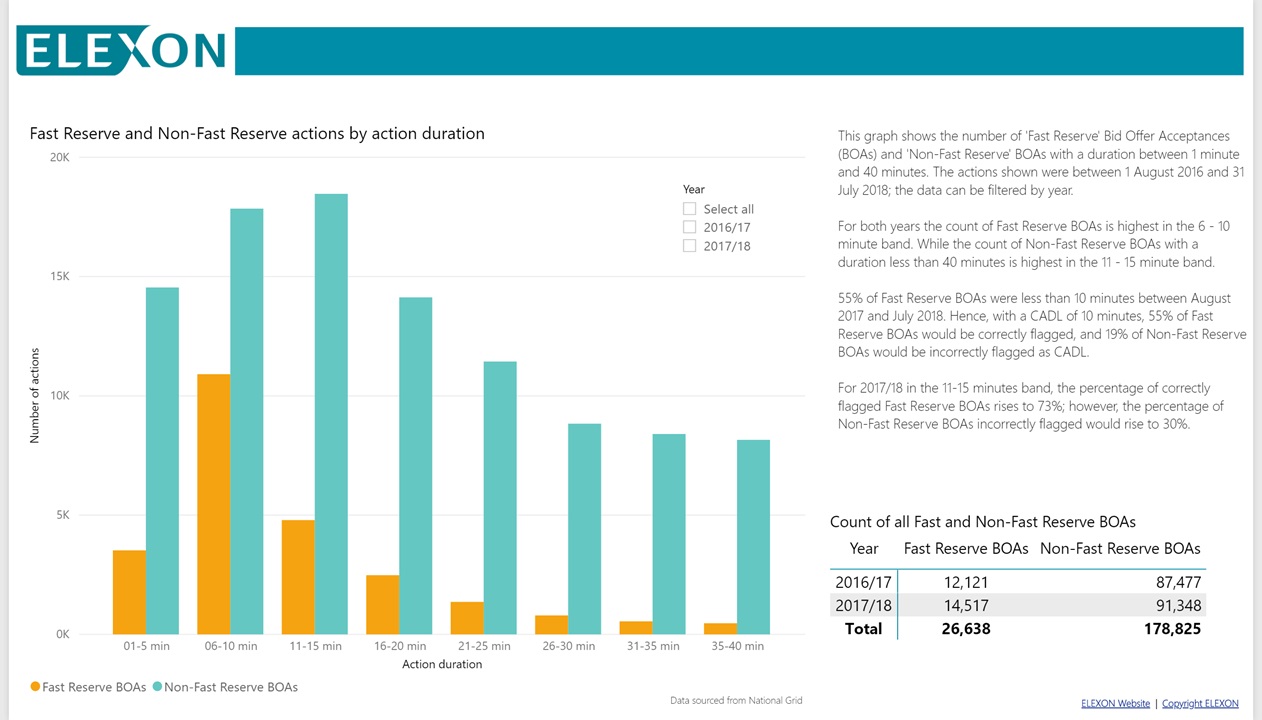
Source: National Grid
This graph shows the number of ‘Fast Reserve’ Bid Offer Acceptances (BOAs) and ‘Non-Fast Reserve’ BOAs with duration between 1 minute and 40 minutes. The actions shown were between 1 August 2016 and 31 July 2018; the data can be filtered by year.
For both years the count of Fast Reserve BOAs is highest in the 6 – 10 minute band, whilst the count of Non-Fast BOAs is highest in the 11 – 15 minute band (for BOAs lasting less than 40 minutes).
55% of Fast Reserve Offers were less than 10 minutes between August 2017 and July 2018. Hence with a CADL of 10 minutes, 55% of Fast Reserve BOAs would be correctly flagged, and 19% of Non-Fast Reserve BOAs would be incorrectly flagged, as CADL.
For 2017/18, the percentage of correctly flagged Fast Reserve BOAs rises to 73% in the 11-15 minutes band; however, the percentage of Non-Fast Reserve BOAs incorrectly flagged rises to 30%.