
BSC Insights: Imbalance Prices go negative on 24 March 2019
The 24 March 2019 saw the longest continuous period of negative Imbalance Prices since a single Imbalance Price was introduced in November 2015. In this article Emma Tribe explains what negative Imbalance Prices are, when they have been occurring, and what Elexon’s data shows about the trends.
Published: April 2019
What are negative Imbalance Prices?
The Imbalance Price reflects a marginal price of balancing energy supply and demand. In 99.77% of Settlement Periods since 2009 the Imbalance Price is positive.
When the Imbalance Price is positive BSC Parties with long Energy Imbalance Volume (surplus of energy) are paid for their Energy Imbalance Volume. However, when the Imbalance Price is negative BSC Parties with a long Imbalance volume pay. In the BSC this is known as the Energy Imbalance Cashflow.
Negative Imbalance Prices on 24 March
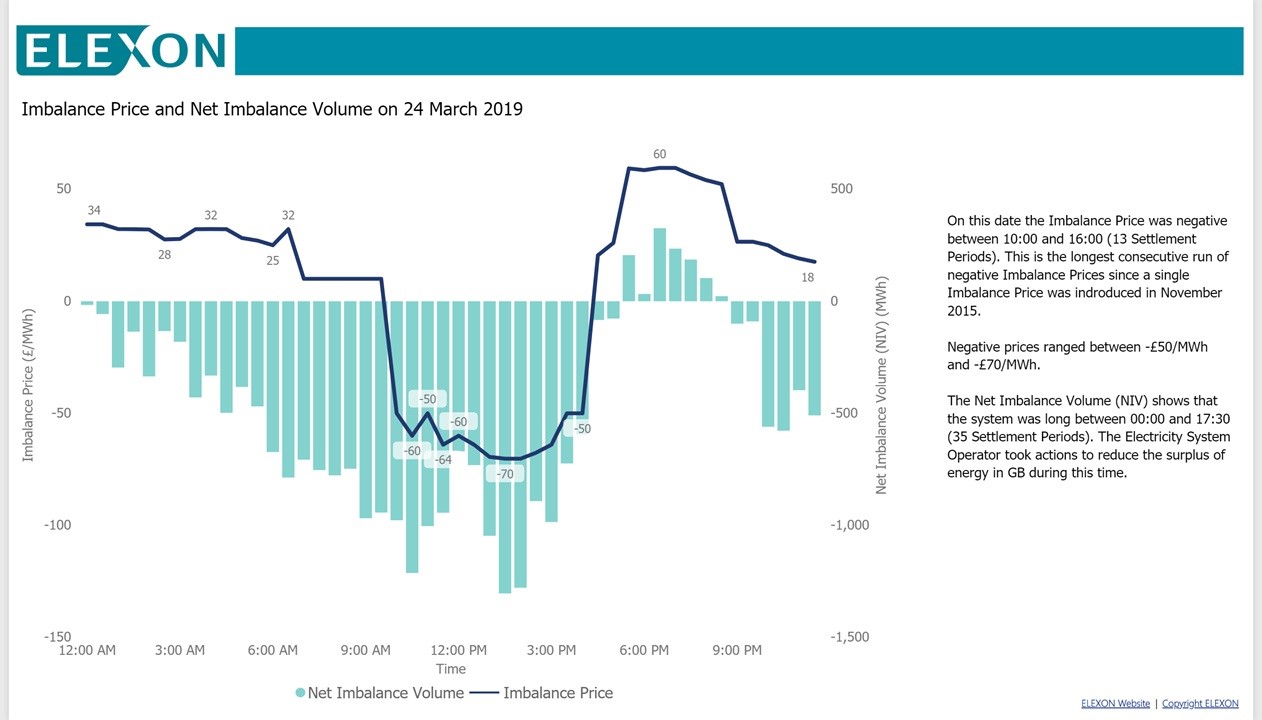
The period from 10:00 to 16:00 on 24 March 2019 was the longest continuous period of negative Imbalance Prices since the single Imbalance Price was introduced in November 2015.
Negative Imbalance Prices ranged between -£50/MWh and -£70/MWh shown in the graph: Imbalance Price and Net Imbalance Volume on 24 March 2019.
The Net Imbalance Volume (NIV) reflects a long system continuously between 00:00 and 17:30 on 24 March 2019. The Electricity System Operator took actions to reduce the surplus of energy in during this time.
Imbalance Price and Net Imbalance Volume on 24 March 2019
Are instances of negative Imbalance Prices increasing?
Since 2014 the number of half hours with negative Imbalance Prices has increased, as shown in graph below.
The highest number of negative Imbalance Prices occurred in 2016. When there were 129 Settlement Periods with negative Imbalance Prices, this is equivalent to two to three negative Imbalance Prices a week.
Negative Imbalance Prices and Negative Market Index Prices by Year
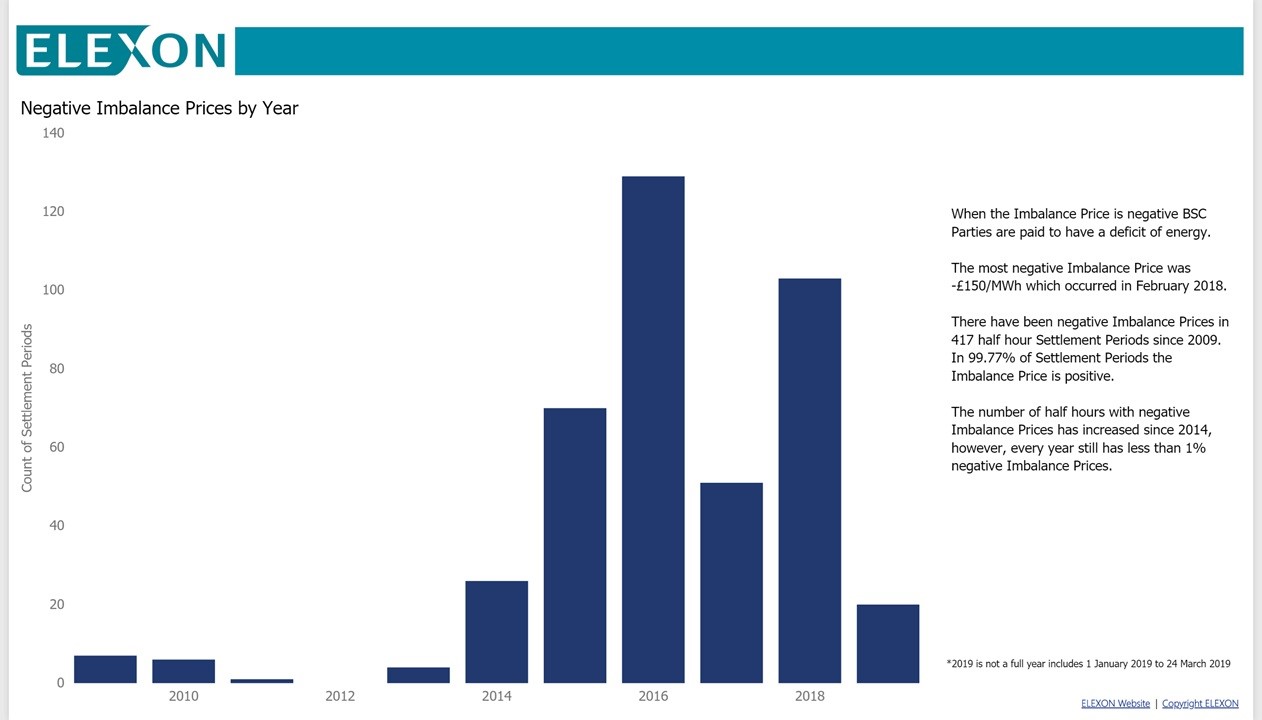
When the Imbalance Price is negative BSC Parties are paid to have a deficit of energy. The most negative Imbalance Price was -£150/MWh which occurred in February 2018.
There have been negative Imbalance Prices in 417 half hour Settlement Periods since 2009. In 99.77% of Settlement Periods the Imbalance Price is positive.
The number of half hours with negative Imbalance Prices has increased in 2014, however, every year still has less than 1% negative Imbalance Prices.
When do negative Imbalance Prices occur?
Since 2014, negative Imbalance Prices tend to occur when there is lower electricity demand and a higher proportion of the fuel mix is from weather dependent generation.
In every year there is a higher percentage of weather dependent generation (wind, embedded wind and embedded solar) in the fuel mix when Imbalance Prices are negative. This coincides with a lower percentage of thermal generation (gas, coal and oil).
Positive and negative Imbalance Price fuel mix
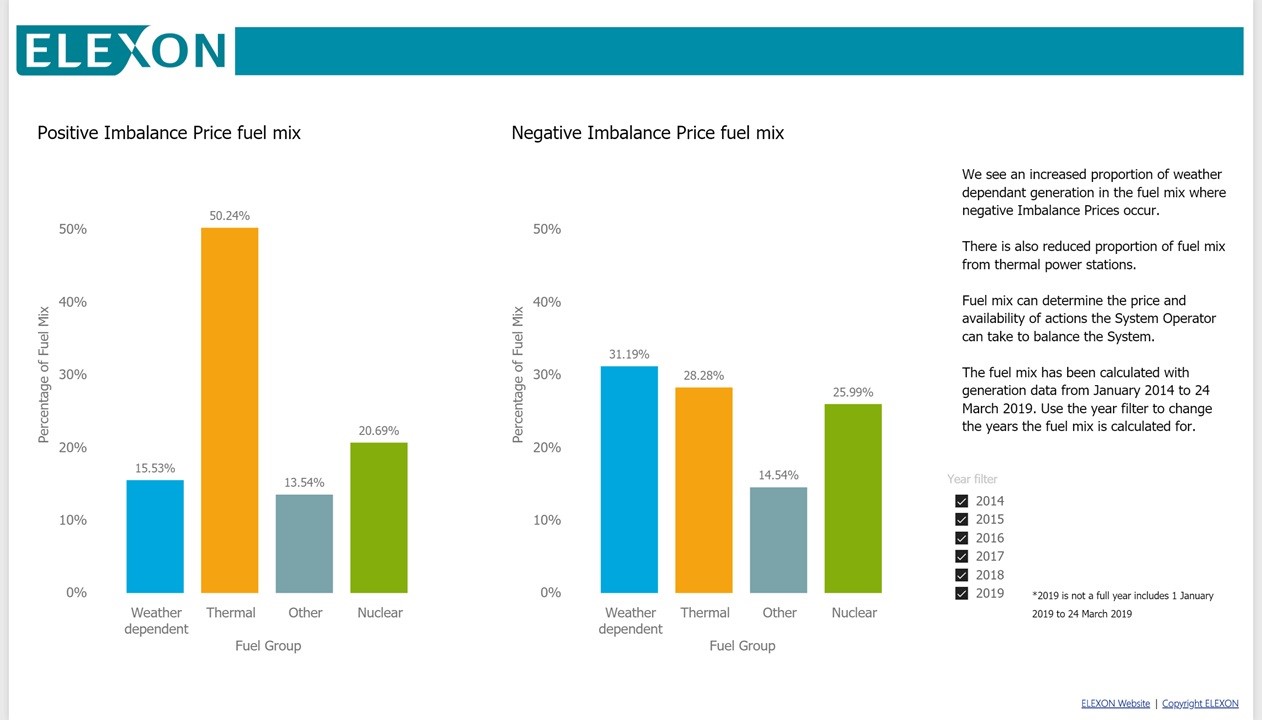
Positive Imbalance Price fuel mix – fuel groups, 2014 – 2019:
- Weather dependent – 15.53%
- Thermal – 50.24%
- Other – 13.54%
- Nuclear – 20.69%
Negative Imbalance Price fuel mix – fuel groups, 2014 – 2019:
- Weather dependent – 31.19%
- Thermal – 28.28%
- Other – 14.54%
- Nuclear – 25.99%
We see an increased proportion of weather dependent generation in the fuel mix were Negative Imbalance Prices occur. There is also reduced proportion of fuel mix from thermal power stations.
Fuel mix can determine the price and availability of actions the System Operator can take to balance the System.
Number of negative Imbalance Prices and electricity demand over a day
Negative Imbalance Prices are also more likely to occur when demand is lower, either overnight, or from midday until late afternoon. This is shown in graph: Number of negative Imbalance Prices and electricity demand over a day.
The average demand when Imbalance Prices are negative is 13.46GWh, compared to 16.69GWh when Imbalance Prices are positive
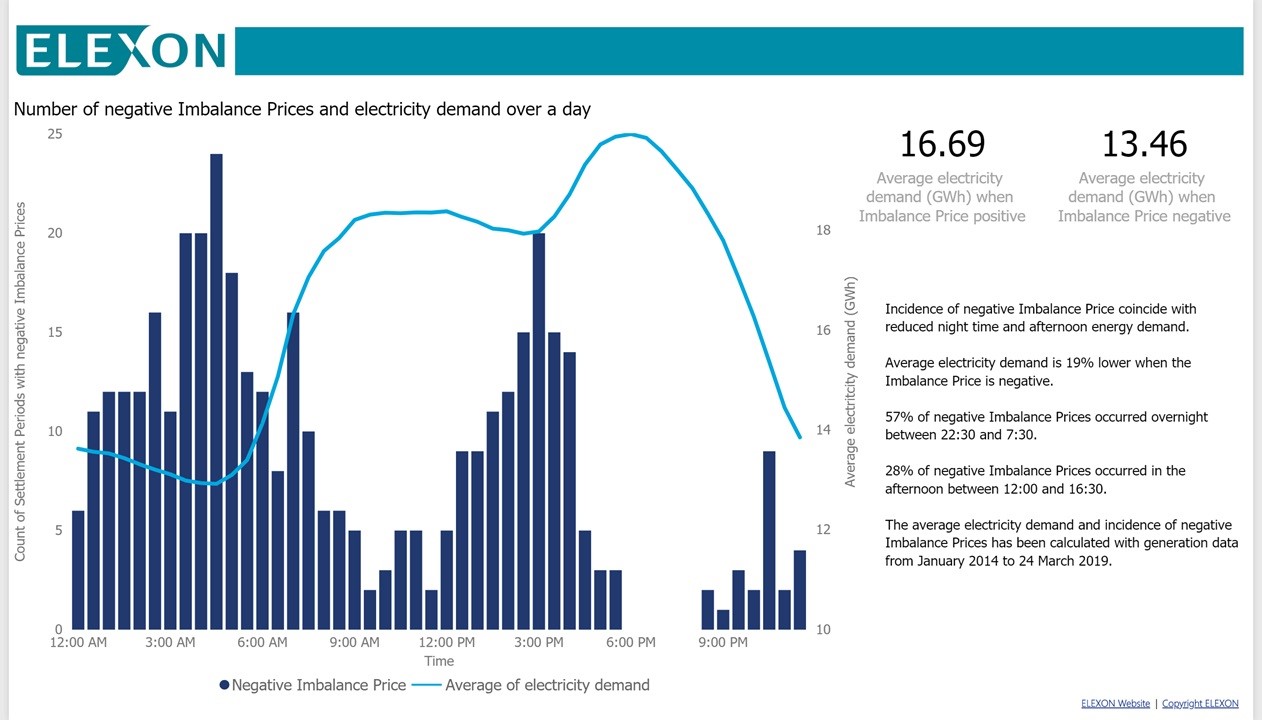
The average electricity demand is 19% lower when the Imbalance Price is negative. 57% of negative Imbalance Prices occurred overnight between 22:30 and 7.30. 28% of negative Imbalance Prices occurred in the afternoon between 12:00 and 16:30.
The average electricity demand and incidence of negative Imbalance Prices has been calculated with generation data from January 2014 to 24 March 2019.