
BSC Insights: 1 November 2018 changes to the System Price Calculation
Emma Tribe’s article looks at how the November 2018 BSC Modification P305 changes can impact System Prices.
Published: September 2018
Recalculating System Prices with November 2018 changes show that prices when the system is short would have increased by an average of £2.69/MWh.
The average decrease when the market is long would have been £0.62/MWh.
What are the 1 November 2018 changes?
The System Price calculation is in its current form as a result of BSC Modification P305. This was a two-step change the first part was implemented on 5 November 2015 and the second part is due to be implemented on 1 November 2018.
The changes to the System Price parameters are as follows:
- Reduction in Price Average Reference (PAR) from 50MWh to 1MWh. From November 2018 onwards the System Price will be based on the price of the marginal 1MWh of balancing actions
- Calculation of the Reserve Scarcity Price (RSP) the Value of Lost Load (VoLL) will increase from £3,000/MWh to £6,000/MWh and the calculation of the Loss of Load Probability (LoLP) will change from a static function to a dynamic function
For this Elexon insight article live System Prices have been recalculated between November 2015 and August 2018 with the PAR set to 1MWh and the VoLL set to £6,000/MWh.
The effect of moving to a dynamic LoLP has not been assessed in this analysis, however the impact was assessed in the March 2018 edition of the System Price Analysis Report.
This analysis concluded that the magnitude of differences between the static and dynamic LoLP is relatively small, leading to only marginal differences in Reserve Scarcity Price (RSP) at gate closure.
You can explore the data further using the System Price Analysis Dashboard.
Difference between Live and November System Price
Graph 1 shows the greatest average difference in short prices occurred in October 2016. The November 2018 calculated price would have been an average of £9.09/MWh more expensive than the live price.
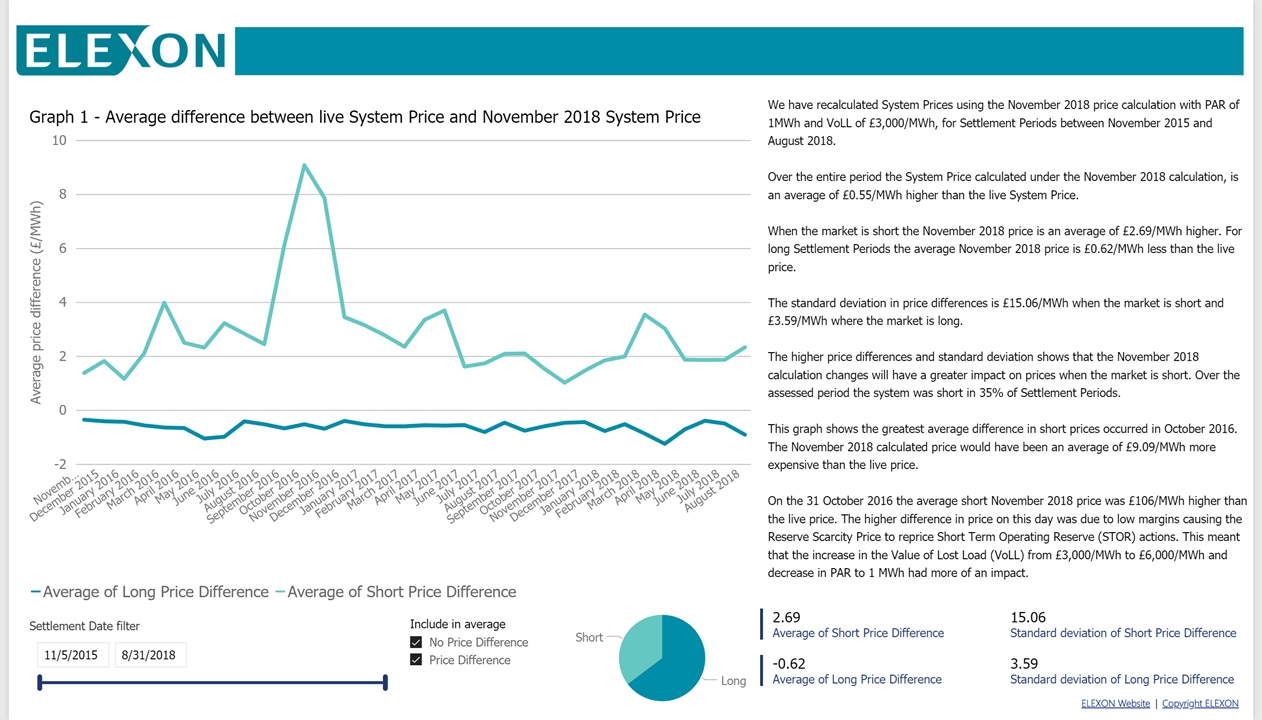
We have recalculated System Prices using the November 2018 price calculation with PAR of 1MWh and VoLL of £3,000/MWh, for Settlement Periods between November 2015 and August 2018.
Over the entire period the System Price calculated under the November 2018 calculation, is an average of £0.55/MWh higher than the live System Price.
When the market is short the November 2018 price is an average of £2.69/MWh higher. For long Settlement Periods the average November 2018 price is £0.62/MWh less than the live price.
The standard deviation in price differences is £15.06/MWh when the market is short and £3.59/MWh where the market is long.
The higher price differences and standard deviation shows that the November 2018 calculation changes will have a greater impact on prices when the market is short. Over the assessed period the system was short in 35% of Settlement Periods.
On the 31 October 2016 the average short November 2018 price was £106/MWh higher than the live price. The higher difference in price on this day was due to low margins causing the Reserve Scarcity Price to reprice Short Term Operating Reserve (STOR) actions.
This meant that the increase in the Value of Lost Load (VoLL) from £3,000/MWh to £6,000/MWh and decrease in PAR to 1 MWh had more of an impact.
Live and November calculations
Graph 2 shows the maximum and minimum System Prices calculated under live and November 2018 calculations.
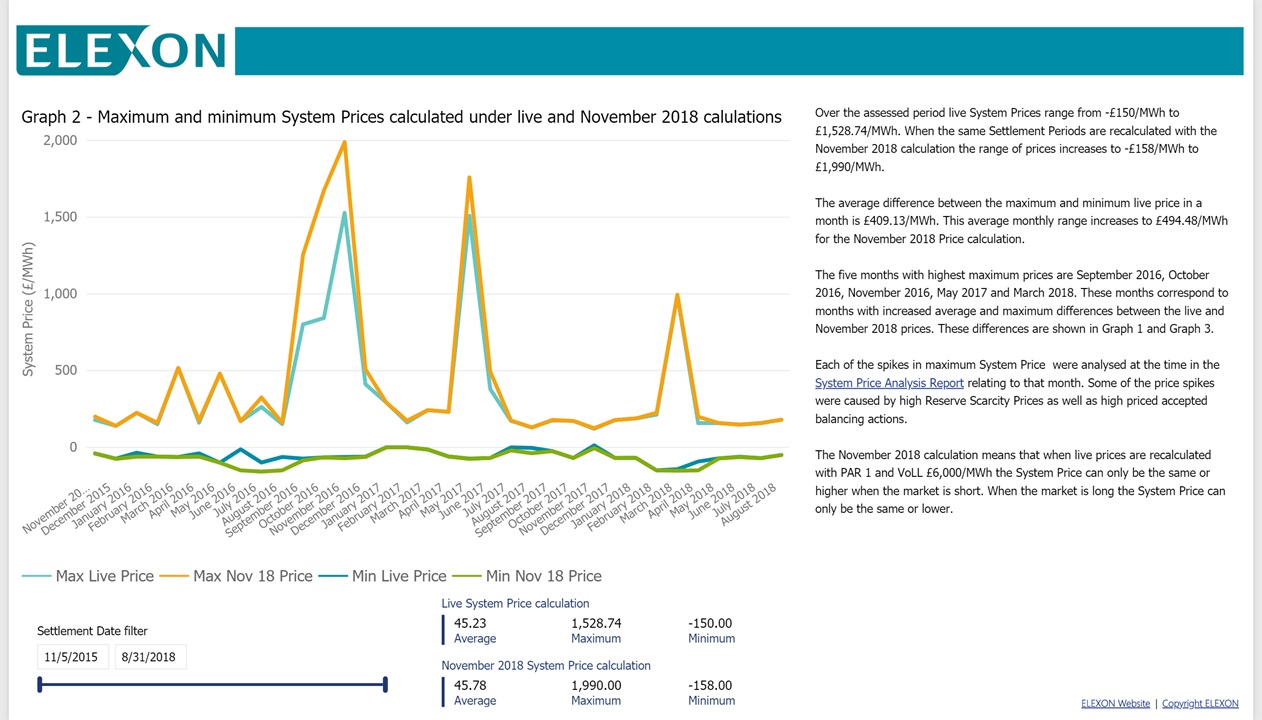
Over the assessed period live System Prices range from -£150/MWh to £1,528.74/MWh. When the same Settlement Periods are recalculated with the November 2018 calculation the range of prices increases to -£158/MWh to £1,990/MWh.
The average difference between the maximum and minimum live price in a month is £409.13/MWh. This average monthly range increases to £494.48/MWh for the November 2018 Price calculation.
The five months with highest maximum prices are September 2016, October 2016, November 2016, May 2017 and March 2018. These months correspond to months with increased average and maximum differences between the live and November 2018 prices. These differences are shown in Graph 1 and Graph 3.
Each of the spikes in maximum System Price were analysed at the time in the System Price Analysis Report relating to that month. Some of the price spikes were caused by high Reserve Scarcity Prices as well as high priced accepted balancing actions.
The November 2018 calculation means that when live prices are recalculated with PAR 1 and VoLL £6,000/MWh the System Price can only be the same or higher when the market is short. When the market is long the System Price can only be the same or lower.
Differences by more than £20/MWh
Graph 3 shows the maximum price differences and number of differences by more than £20/MWh.
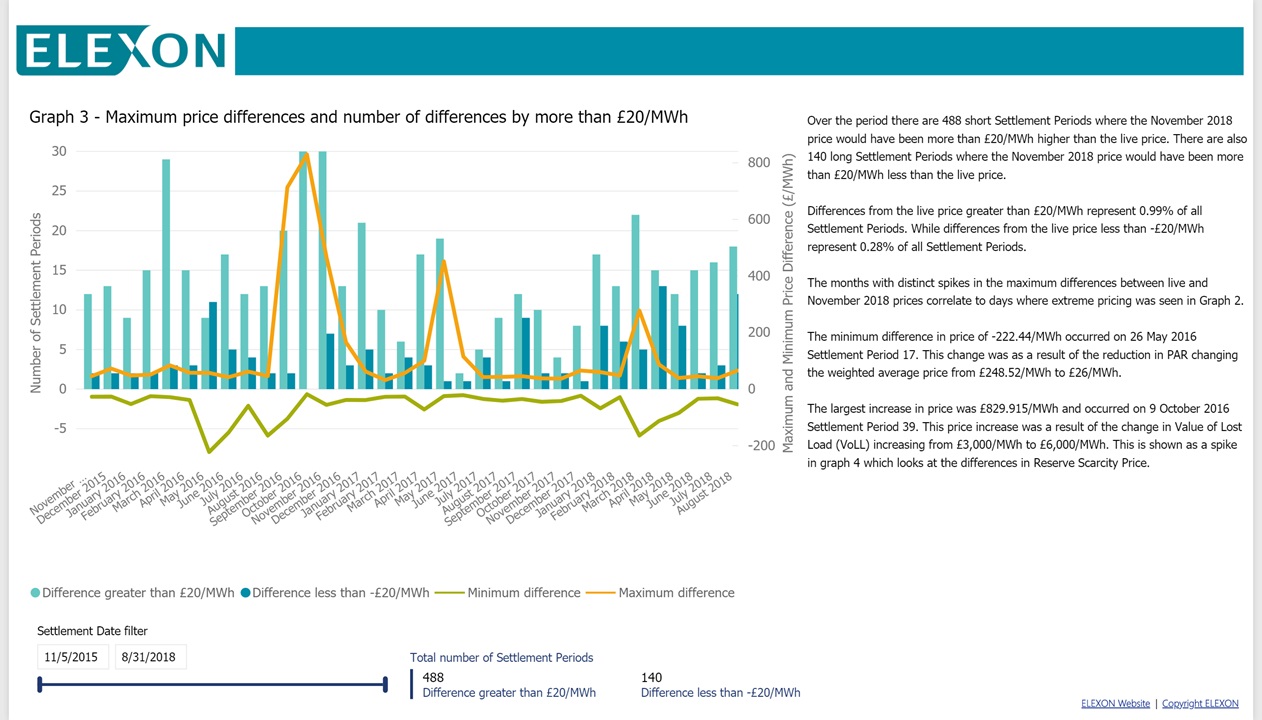
Over the period there are 488 short Settlement Periods where the November 2018 price would have been more than £20/MWh higher than the live price. There are also 140 long Settlement Periods where the November 2018 price would have been more than £20/MWh less than the live price.
Differences from the live price greater than £20/MWh represent 0.99% of all Settlement Periods. While differences from the live price less than -£20/MWh represent 0.28% of all Settlement Periods.
The months with distinct spikes in the maximum differences between live and November 2018 prices correlate to days where extreme pricing was seen in Graph 2.
The minimum difference in price of -222.44/MWh occurred on 26 May 2016 Settlement Period 17. This change was as a result of the reduction in PAR changing the weighted average price from £248.52/MWh to £26/MWh.
The largest increase in price was £829.915/MWh and occurred on 9 October 2016 Settlement Period 39. This price increase was a result of the change in Value of Lost Load (VoLL) increasing from £3,000/MWh to £6,000/MWh. This is shown as a spike in graph 4 which looks at the differences in Reserve Scarcity Price.
Reserve Scarcity Price
Graph 4 shows the live and November 2018 Reserve Scarcity Price.
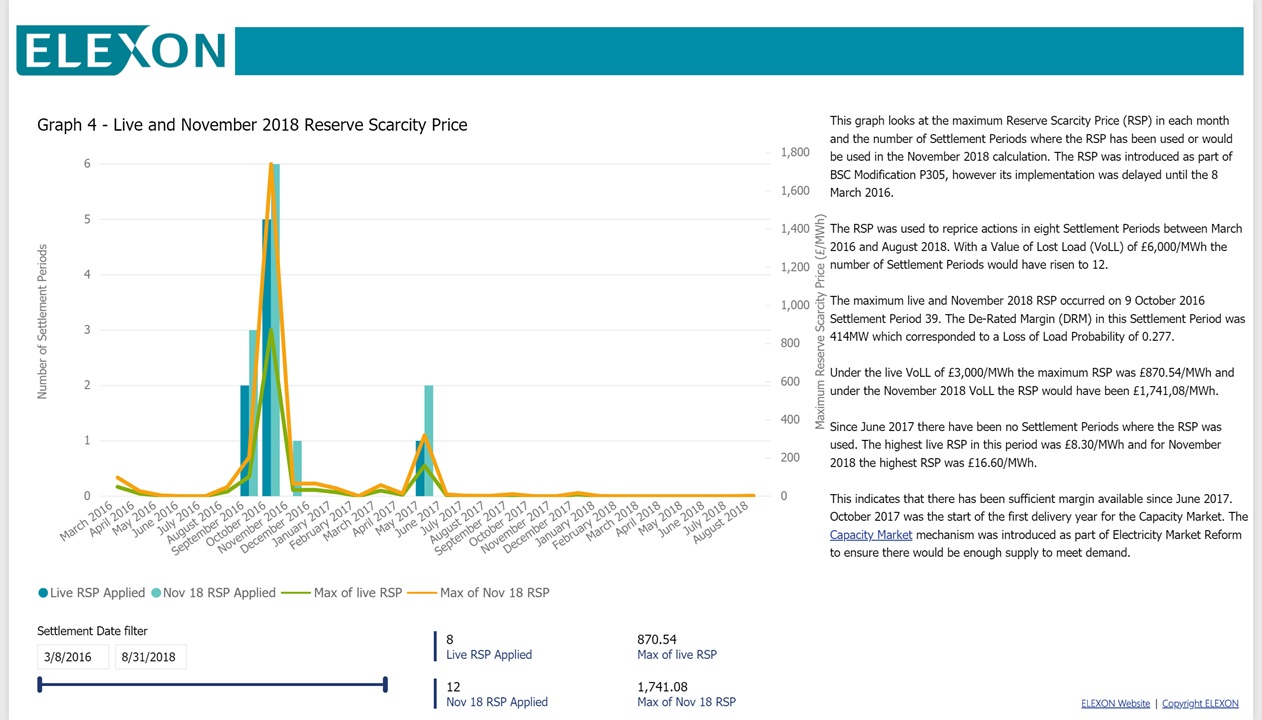
This graph looks at the maximum Reserve Scarcity Price (RSP) in each month and the number of Settlement Periods where the RSP has been used or would be used in the November 2018 calculation.
The RSP was introduced as part of BSC Modification P305, however its implementation was delayed until the 8 March 2016.
The RSP was used to reprice actions in eight Settlement Periods between March 2016 and August 2018. With a Value of Lost Load (VoLL) of £6,000/MWh the number of Settlement Periods would have risen to 12.
The maximum live and November 2018 RSP occurred on 9 October 2016 Settlement Period 39. The De-Rated Margin (DRM) in this Settlement Period was 414MW which corresponded to a Loss of Load Probability of 0.277.
Under the live VoLL of £3,000/MWh the maximum RSP was £870.54/MWh and under the November 2018 VoLL the RSP would have been £1,741,08/MWh.
Since June 2017 there have been no Settlement Periods where the RSP was used. The highest live RSP in this period was £8.30/MWh and for November 2018 the highest RSP was £16.60/MWh.
This indicates that there has been sufficient margin available since June 2017. October 2017 was the start of the first delivery year for the Capacity Market.
The Capacity Market mechanism was introduced as part of Electricity Market Reform to ensure there would be enough supply to meet demand.